

HOT TOPICS LIST
- MACD
- Fibonacci
- RSI
- Gann
- ADXR
- Stochastics
- Volume
- Triangles
- Futures
- Cycles
- Volatility
- ZIGZAG
- MESA
- Retracement
- Aroon
INDICATORS LIST
LIST OF TOPICS
PRINT THIS ARTICLE
by Matt Blackman
Borrowing stock to sell short has limited upside if you get it right but unlimited downside if you're wrong. Here is a way to bet on a correction while limiting risk.
Position: N/A
Matt Blackman
Matt Blackman is a full-time technical and financial writer and trader. He produces corporate and financial newsletters, and assists clients in getting published in the mainstream media. He is the host of TradeSystemGuru.com. Matt has earned the Chartered Market Technician (CMT) designation. Find out what stocks and futures Matt is watching on Twitter at www.twitter.com/RatioTrade
PRINT THIS ARTICLE
OPTIONS TRADING
That's One Way To Bet On A Falling Market Without Having To Sell Short!
12/18/13 11:16:26 AMby Matt Blackman
Borrowing stock to sell short has limited upside if you get it right but unlimited downside if you're wrong. Here is a way to bet on a correction while limiting risk.
Position: N/A
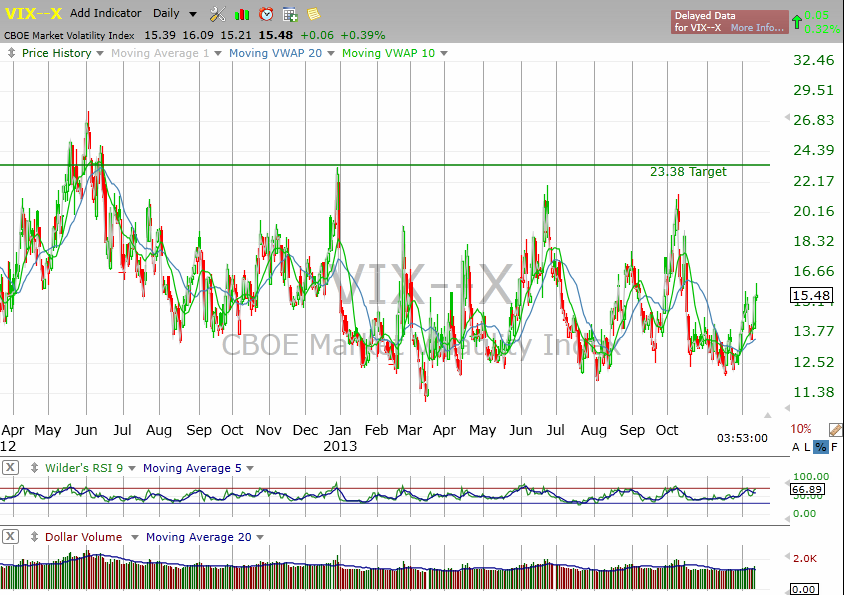
| While traders and investors patiently waited for the year-end Santa Claus rally to hit Wall Street, one trader made a bold bearish bet. He purchased 40,000 April call options on the Chicago Board Options Exchange Volatility Index (VIX) for $1.28 each with a strike price of 22 for a total cost of $5.12 million according to a December 12, 2013 Bloomberg article. The VIX closed at 15.28 that day which means the VIX must jump more than 50% to 23.38 to become profitable after factoring in the cost of options premiums. It was the biggest single block of options to trade on US exchanges according to the article and accounted for 9% of VIX trading volume. The last time the VIX traded above 23 was on June 15, 2012. |
|
| Figure 1 � Daily chart of the CBOE VIX showing the $5.12 million options trade target threshold. |
| Graphic provided by: TC2000.com. |
| |
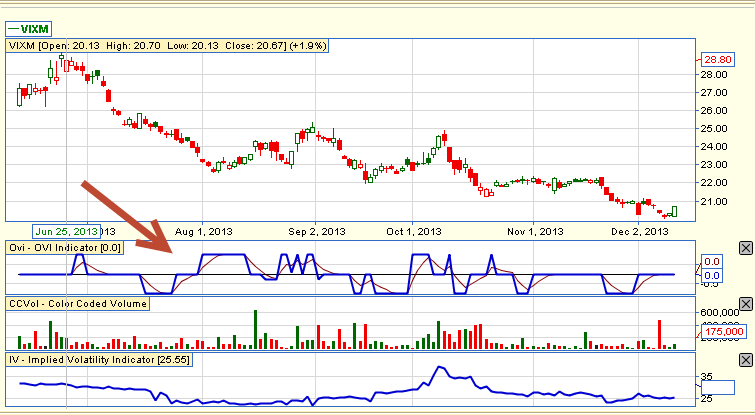
| So why is this trade important? First, options and commercial futures traders tend to have a better record at picking market direction, so that such a huge bearish bet was made is significant. As you see in the chart in Figure 2 showing the Proshares VIX Mid-Term Futures ETF (VIXM), in November, option traders were betting more heavily on a falling VIX until December 2 when they turned neutral as evidenced by the OVI. The indicator measures options transaction activity by way of implied volatility (IV), open interest and options volume, according to FlagTrader.com. It has a range of values from +1 to -1. A positive OVI reading often occurs ahead of rising stock prices while negative readings typically precede falling prices. However, this chart does not include data on December 12 when the big options trade was made. |
|
| Figure 2 � Daily chart showing VIXM together with the OVI (middle subgraph) and Implied Volatility (lower subgraph). |
| Graphic provided by: www.FlagTrader.com. |
| |
| As well, this is just another of the growing number of market topping signs which have been building since February 2012 (see "More Stock Market Topping Signs") |
| I outline the advantages of playing volatility in "Is Trading Volatility a Worthwhile Plan?" But perhaps the biggest advantage is the ability to make a long trade on a falling market, since volatility generally moves in the opposite direction to stock prices. The advantage of buying options is that trade risk is limited to the cost of the option unlike a short trade in which the risk is potentially unlimited if the trade goes horribly wrong. |
| Suggested Reading: VIX Trader Buys $5.1 Million in Calls to Bet on 50% Increase Tesla H&S Trade Update |
Matt Blackman is a full-time technical and financial writer and trader. He produces corporate and financial newsletters, and assists clients in getting published in the mainstream media. He is the host of TradeSystemGuru.com. Matt has earned the Chartered Market Technician (CMT) designation. Find out what stocks and futures Matt is watching on Twitter at www.twitter.com/RatioTrade
| Company: | TradeSystemGuru.com |
| Address: | Box 2589 |
| Garibaldi Highlands, BC Canada | |
| Phone # for sales: | 604-898-9069 |
| Fax: | 604-898-9069 |
| Website: | www.tradesystemguru.com |
| E-mail address: | indextradermb@gmail.com |
Traders' Resource Links | |
| TradeSystemGuru.com has not added any product or service information to TRADERS' RESOURCE. | |
Click here for more information about our publications!
Comments

Request Information From Our Sponsors
- StockCharts.com, Inc.
- Candle Patterns
- Candlestick Charting Explained
- Intermarket Technical Analysis
- John Murphy on Chart Analysis
- John Murphy's Chart Pattern Recognition
- John Murphy's Market Message
- MurphyExplainsMarketAnalysis-Intermarket Analysis
- MurphyExplainsMarketAnalysis-Visual Analysis
- StockCharts.com
- Technical Analysis of the Financial Markets
- The Visual Investor
- VectorVest, Inc.
- Executive Premier Workshop
- One-Day Options Course
- OptionsPro
- Retirement Income Workshop
- Sure-Fire Trading Systems (VectorVest, Inc.)
- Trading as a Business Workshop
- VectorVest 7 EOD
- VectorVest 7 RealTime/IntraDay
- VectorVest AutoTester
- VectorVest Educational Services
- VectorVest OnLine
- VectorVest Options Analyzer
- VectorVest ProGraphics v6.0
- VectorVest ProTrader 7
- VectorVest RealTime Derby Tool
- VectorVest Simulator
- VectorVest Variator
- VectorVest Watchdog