HOT TOPICS LIST
- MACD
- Fibonacci
- RSI
- Gann
- ADXR
- Stochastics
- Volume
- Triangles
- Futures
- Cycles
- Volatility
- ZIGZAG
- MESA
- Retracement
- Aroon
INDICATORS LIST
LIST OF TOPICS
PRINT THIS ARTICLE
by Matt Blackman
In my Traders.com Advantage article "Four Stock Topping Signs," I discussed four conditions that warned of a potential top in stocks. Here are some more concerning signs from two other independent sources.
Position: Sell
Matt Blackman
Matt Blackman is a full-time technical and financial writer and trader. He produces corporate and financial newsletters, and assists clients in getting published in the mainstream media. He is the host of TradeSystemGuru.com. Matt has earned the Chartered Market Technician (CMT) designation. Find out what stocks and futures Matt is watching on Twitter at www.twitter.com/RatioTrade
PRINT THIS ARTICLE
BULL/BEAR MARKET
More Stock Market Topping Signs
02/07/13 12:39:15 PMby Matt Blackman
In my Traders.com Advantage article "Four Stock Topping Signs," I discussed four conditions that warned of a potential top in stocks. Here are some more concerning signs from two other independent sources.
Position: Sell
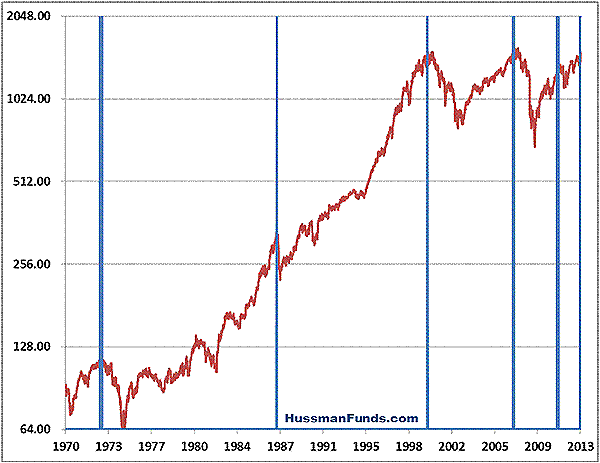
| In one of those coincidences that can make this business even more interesting, the day that my article "Four Stock Topping Signs" was published, two other articles on the same topic appeared in the financial media. The first was by respected fund manager John Hussman entitled "A Reluctant Bear's Guide To The Universe." Based on some key stock market metrics, present market conditions (as of late January 2013) match six other times in history: August 1929, November 1972, August 1987, March 2000, May 2007, and January 2011. These times are shown by the vertical blue lines in Figure 1. |

|
| FIGURE 1: SPX. This chart goes back to 1970 showing the five prior top readings. |
| Graphic provided by: Chart courtesy of http://www.HussmanFunds.com. |
| |
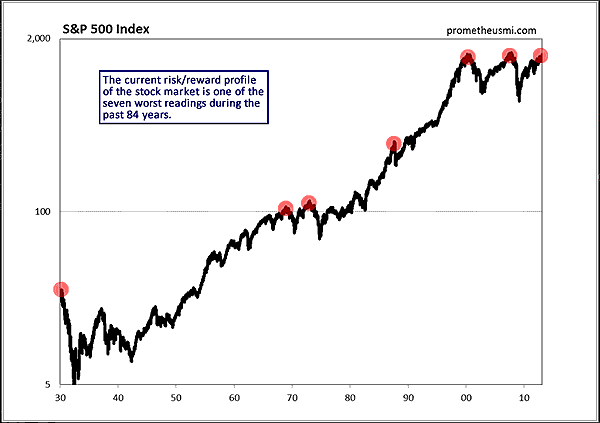
| Here are the market conditions that each of the periods including the latest period shared, which, according to Hussman, preceded drops ranging from 20% (post January 2011) to 85% (post August 1929) and exceeded 50% on average. -According to the price/earnings ratio developed by Robert Shiller that utilizes trailing 10-year earnings (as opposed to trailing 12-month), the Standard & Poor's 500 is well above a value of 18, which Shiller considers overvalued with a current reading of 22.6. -Hussman considers the SPX overbought when it is more than 7% above its 52-week moving average, at least 50% above its four-year low and within 3% of its upper Bollinger Band. Currently, the SPX is either at or above these three measures. -Investor sentiment as measured by Investors Intelligence in which bullishness is confirmed when bulls number more than 52% and the bears less than 28%. At the end of January 2013, investors were 54.3% and 22.3% bearish. -Hussman's final condition requires that 10-year US Treasury yields are rising and above the level of six months prior. Another paper entitled "Historic Stock Market Risk Continues To Warrant Extreme Caution" published the same day by Prometheus Market Insight (PMI) referenced Hussman's paper and presented a similar argument. An organization that combines fundamental, technical, sentiment, and cyclical data to determine both cyclical and secular "extremes in the risk/reward profile of the stock market," PMI revealed nearly identical signals (with one exception since 1970). "As of [late January 2013] stock market risk has increased to the highest one percentile of all historical observations, joining a select group of time periods," the PMI paper reported. Figure 2 shows previous tops (red dots) on the S&P 500 going back to the late 1920s (in the 50 years prior to 1970, there was only one signal but it was a biggie). |

|
| FIGURE 2: SPX. Here's a longer-term chart showing previous tops going back 84 years, with the most recent signal firing at the end of January 2013. |
| Graphic provided by: Chart courtesy of http://www.prometheusmi.com/. |
| |
| So what are the risks that these signals could be wrong? Both signals are based on macro market conditions using monthly data. No indicator that I am aware of is 100% correct. The rally could continue on its merry way for days, weeks, or even months before we experience the next significant correction. As a case on point, Hussman discussed the last signal in January 2011, which was muted in effect thanks to trillions of dollars in stimulus a la various QEs and the new, unprecedented "too big to fail" dogma in Washington regarding our biggest corporations. |
| However, PMI issues a confidence rating on calls ranging from 50% to 80%. Their Secular Trend Scores have identified every major secular inflection point since 1929 and their Cyclical Trend Scores have correctly identified more than 90% of all cyclical inflation points. As mentioned, the company considers this latest call among the highest one percentile of all historical observations, so it assigns a high probability to the signal being right. |
| Only time will tell how this situation plays out but when presented with evidence like this from different credible sources, it pays to give it credence and take appropriate defensive action. |
Matt Blackman is a full-time technical and financial writer and trader. He produces corporate and financial newsletters, and assists clients in getting published in the mainstream media. He is the host of TradeSystemGuru.com. Matt has earned the Chartered Market Technician (CMT) designation. Find out what stocks and futures Matt is watching on Twitter at www.twitter.com/RatioTrade
| Company: | TradeSystemGuru.com |
| Address: | Box 2589 |
| Garibaldi Highlands, BC Canada | |
| Phone # for sales: | 604-898-9069 |
| Fax: | 604-898-9069 |
| Website: | www.tradesystemguru.com |
| E-mail address: | indextradermb@gmail.com |
Traders' Resource Links | |
| TradeSystemGuru.com has not added any product or service information to TRADERS' RESOURCE. | |
Click here for more information about our publications!
PRINT THIS ARTICLE

|

Request Information From Our Sponsors
- StockCharts.com, Inc.
- Candle Patterns
- Candlestick Charting Explained
- Intermarket Technical Analysis
- John Murphy on Chart Analysis
- John Murphy's Chart Pattern Recognition
- John Murphy's Market Message
- MurphyExplainsMarketAnalysis-Intermarket Analysis
- MurphyExplainsMarketAnalysis-Visual Analysis
- StockCharts.com
- Technical Analysis of the Financial Markets
- The Visual Investor
- VectorVest, Inc.
- Executive Premier Workshop
- One-Day Options Course
- OptionsPro
- Retirement Income Workshop
- Sure-Fire Trading Systems (VectorVest, Inc.)
- Trading as a Business Workshop
- VectorVest 7 EOD
- VectorVest 7 RealTime/IntraDay
- VectorVest AutoTester
- VectorVest Educational Services
- VectorVest OnLine
- VectorVest Options Analyzer
- VectorVest ProGraphics v6.0
- VectorVest ProTrader 7
- VectorVest RealTime Derby Tool
- VectorVest Simulator
- VectorVest Variator
- VectorVest Watchdog
