

HOT TOPICS LIST
- MACD
- Fibonacci
- RSI
- Gann
- ADXR
- Stochastics
- Volume
- Triangles
- Futures
- Cycles
- Volatility
- ZIGZAG
- MESA
- Retracement
- Aroon
INDICATORS LIST
LIST OF TOPICS
PRINT THIS ARTICLE
by Matt Blackman
In my October 2013 Traders.com Advantage article, "Is Tesla Set to Go Into Reverse?" I made the case that a bearish Head & Shoulders pattern warned of a top in the electric car maker. It hit its minimum projected target. So what's next?
Position: N/A
Matt Blackman
Matt Blackman is a full-time technical and financial writer and trader. He produces corporate and financial newsletters, and assists clients in getting published in the mainstream media. He is the host of TradeSystemGuru.com. Matt has earned the Chartered Market Technician (CMT) designation. Find out what stocks and futures Matt is watching on Twitter at www.twitter.com/RatioTrade
PRINT THIS ARTICLE
BULL/BEAR MARKET
Tesla H&S Trade Update
11/18/13 04:49:48 PMby Matt Blackman
In my October 2013 Traders.com Advantage article, "Is Tesla Set to Go Into Reverse?" I made the case that a bearish Head & Shoulders pattern warned of a top in the electric car maker. It hit its minimum projected target. So what's next?
Position: N/A
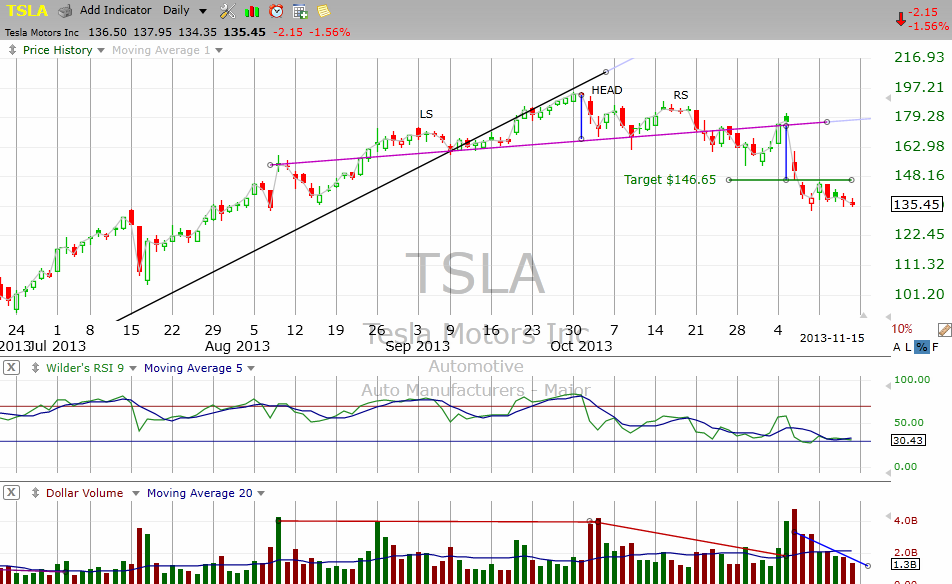
| Between December 31, 2012 and the high on September 27, 2013, Tesla stock rocketed up 474.3%. But then the stock put in the second half of a bearish Head & Shoulders top pattern and with the breach of its upward sloping neckline targeted a minimum target of $146.65. |
|
| Figure 1. Daily chart showing bearish TSLA Head & Shoulders pattern and target. |
| Graphic provided by: TC2000.com. |
| |
| But the trade was anything but straight-forward. After first breaching its neckline on October 22, TSLA briefly popped above the neckline to just north of $174 the next day. This is generally when a short trade is taken. However, after hitting a multi-week low on Halloween, TSLA again surged above the neckline on above-average volume November 5 to a high of $181.43. But earnings announced after-close that day came in well below expectations and the stock dropped for the next three trading days into the mid-$130 range. |
| In other words, those who made money on this trade would have done so by betting on an earnings disappointment which is usually risky, except for the fact that this was the 9th consecutive quarterly TSLA earnings disappointment... |
|
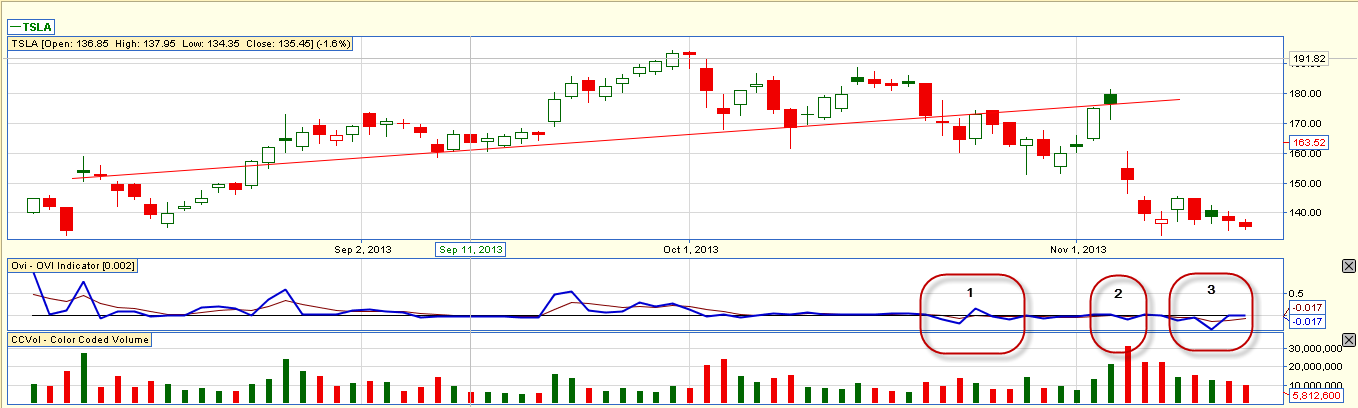
| Figure 2. Chart showing TSLA Head & Shoulders with the OVI indicator which measures TSLA options activity. |
| Graphic provided by: www.FlagTrader.com. |
| |
| From an options perspective, TSLA began flashing a negative OVI reading in late October (see oval 1 in Figure 2) meaning that options traders were placing bearish bets on the stock. OVI is an indicator that measures options transaction activity by way of Implied Volatility, Open Interest and Options Volume, according to FlagTrader.com. It has a range of values from +1 to -1. A positive OVI reading often occurs ahead of rising stock prices while negative readings typically precede falling prices. |
| But we can also see that options traders remained bearish leading up to earnings (oval 2) even as the stock rallied above the neckline as evidenced by the fact that the OVI continued to hug the zero line. As of November 15, the OVI remained flat (oval 3) meaning that options traders were not expecting the stock to rally in the near future. TSLA traders will get cues about future TSLA direction by watching price and volume action. As Figures 1 & 2 show, volume was dropping and price stabilizing as of mid-November as this normally volatile stock plumbs for support. It won't take much in the way of negative news to pull this stock lower after such a huge run-up, especially if the Thanksgiving Yellen-driven stock rally hiccups. |
Matt Blackman is a full-time technical and financial writer and trader. He produces corporate and financial newsletters, and assists clients in getting published in the mainstream media. He is the host of TradeSystemGuru.com. Matt has earned the Chartered Market Technician (CMT) designation. Find out what stocks and futures Matt is watching on Twitter at www.twitter.com/RatioTrade
| Company: | TradeSystemGuru.com |
| Address: | Box 2589 |
| Garibaldi Highlands, BC Canada | |
| Phone # for sales: | 604-898-9069 |
| Fax: | 604-898-9069 |
| Website: | www.tradesystemguru.com |
| E-mail address: | indextradermb@gmail.com |
Traders' Resource Links | |
| TradeSystemGuru.com has not added any product or service information to TRADERS' RESOURCE. | |
Click here for more information about our publications!
Comments
Date:�11/20/13Rank:�5Comment:�

Request Information From Our Sponsors
- StockCharts.com, Inc.
- Candle Patterns
- Candlestick Charting Explained
- Intermarket Technical Analysis
- John Murphy on Chart Analysis
- John Murphy's Chart Pattern Recognition
- John Murphy's Market Message
- MurphyExplainsMarketAnalysis-Intermarket Analysis
- MurphyExplainsMarketAnalysis-Visual Analysis
- StockCharts.com
- Technical Analysis of the Financial Markets
- The Visual Investor
- VectorVest, Inc.
- Executive Premier Workshop
- One-Day Options Course
- OptionsPro
- Retirement Income Workshop
- Sure-Fire Trading Systems (VectorVest, Inc.)
- Trading as a Business Workshop
- VectorVest 7 EOD
- VectorVest 7 RealTime/IntraDay
- VectorVest AutoTester
- VectorVest Educational Services
- VectorVest OnLine
- VectorVest Options Analyzer
- VectorVest ProGraphics v6.0
- VectorVest ProTrader 7
- VectorVest RealTime Derby Tool
- VectorVest Simulator
- VectorVest Variator
- VectorVest Watchdog