

HOT TOPICS LIST
- MACD
- Fibonacci
- RSI
- Gann
- ADXR
- Stochastics
- Volume
- Triangles
- Futures
- Cycles
- Volatility
- ZIGZAG
- MESA
- Retracement
- Aroon
INDICATORS LIST
LIST OF TOPICS
PRINT THIS ARTICLE
by Matt Blackman
Year-to-date to October 29, 2013, Tesla stock is up around 400%. But is the stock red-lining?
Position: N/A
Matt Blackman
Matt Blackman is a full-time technical and financial writer and trader. He produces corporate and financial newsletters, and assists clients in getting published in the mainstream media. He is the host of TradeSystemGuru.com. Matt has earned the Chartered Market Technician (CMT) designation. Find out what stocks and futures Matt is watching on Twitter at www.twitter.com/RatioTrade
PRINT THIS ARTICLE
PUT/CALL RATIO
Is Tesla Set To Go Into Reverse?
10/31/13 03:30:15 PMby Matt Blackman
Year-to-date to October 29, 2013, Tesla stock is up around 400%. But is the stock red-lining?
Position: N/A
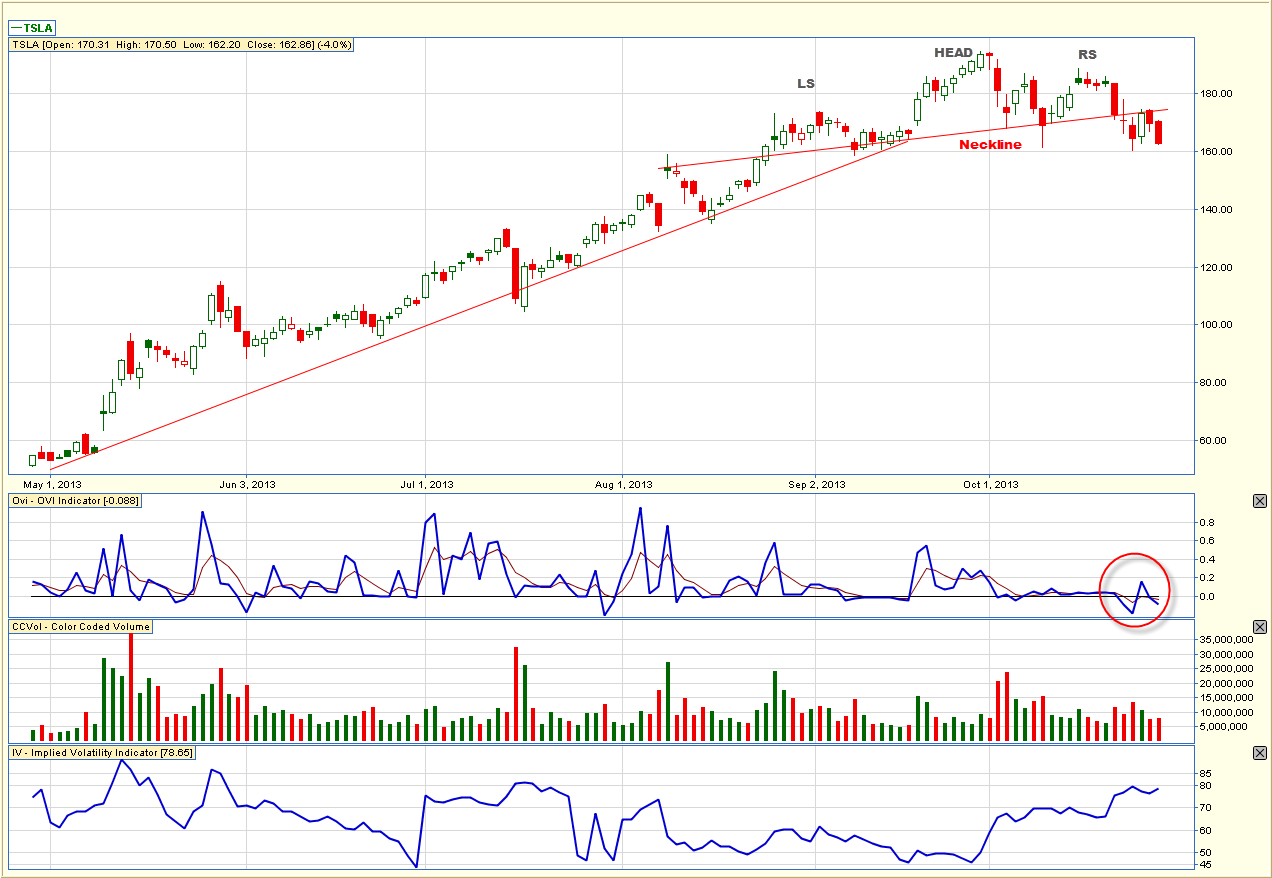
| In my June 2013 article, "Tesla - Is the Parabolic Run Done?" I discussed the parabolic move the stock was making accompanied by a bearish looking potential head & shoulders pattern in an attempt to determine if Tesla (TSLA) was getting tired. As it turned out, the H&S pattern was never confirmed and in the nearly four months since, the stock added another 60+%. That pattern has appeared again on the TSLA chart but this time there are some more bearish indicators that this stock may be in for a correction. As we see in Figure 1, TSLA broke uptrend support in early October. |
|
| Figure 1. Daily chart of Telsa showing the uptrend support line, upward sloping head & shoulders top pattern and major support around $160. Note the break below the zero line on the right-hand side in the OVI indicator which shows that options traders are taking bearish positions in the stock. |
| Graphic provided by: www.FlagTrader.com. |
| |
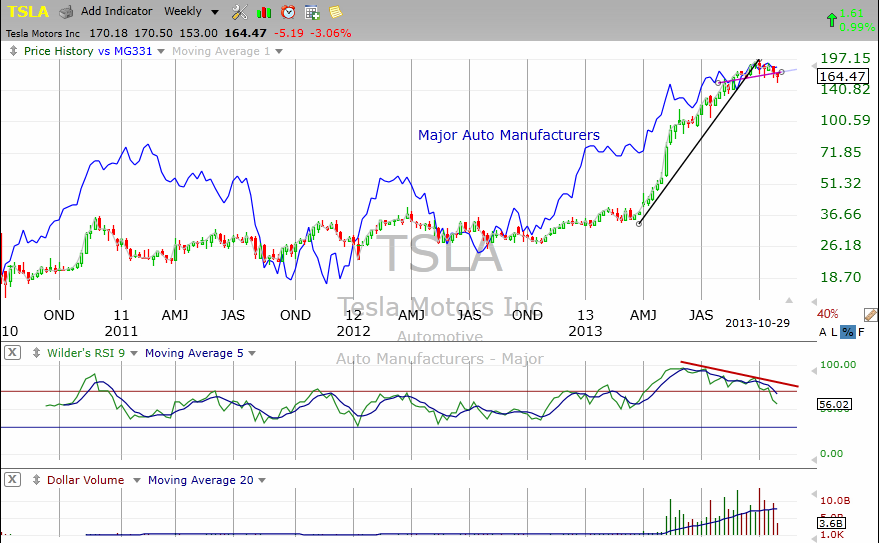
| We also see in Figure 1, TSLA began flashing a negative OVI reading (red circle in the middle sub-graph) in late October. According to FlagTrader.com, the OVI is an indicator that measures options transaction activity by way of Implied Volatility, Open Interest and Options Volume and has a range from +1 to -1. A positive OVI reading often occurs ahead of rising stock prices while negative readings typically often precede falling prices. In other words, options traders were getting increasingly more bearish on the stock. At last check, the put/call ratio was 1.09 meaning there were more puts than calls on the stock. The longer-term picture is presented in Figure 2 which shows the breach in the uptrend support line as well as negative divergence between the RSI and TSLA followed by an RSI sell signal. |
|
| Figure 2. Weekly chart showing TSLA with Major Auto Manufacturers (blue line) with the RSI bearish divergence and sell signal (red line). |
| Graphic provided by: TC2000.com. |
| |
| With TSLA getting set to release earnings November 5, the stock chart is telling us that traders aren't expecting good news. According to TC2000.com, TSLA lost $0.26/share last quarter. Wall Street analysts are forecasting Q3 earnings of $0.11/share but TSLA earnings have fallen short of expectations in the last eight quarters, according to Schaeffer's Research. |
| However, given Tesla's habit of punishing short sellers, it may be a tad early to go short but taking profit on long positions may not be a bad idea. That could change if major support around $160 is decisively breached as the chances of the stock falling further will greatly increase. |
Matt Blackman is a full-time technical and financial writer and trader. He produces corporate and financial newsletters, and assists clients in getting published in the mainstream media. He is the host of TradeSystemGuru.com. Matt has earned the Chartered Market Technician (CMT) designation. Find out what stocks and futures Matt is watching on Twitter at www.twitter.com/RatioTrade
| Company: | TradeSystemGuru.com |
| Address: | Box 2589 |
| Garibaldi Highlands, BC Canada | |
| Phone # for sales: | 604-898-9069 |
| Fax: | 604-898-9069 |
| Website: | www.tradesystemguru.com |
| E-mail address: | indextradermb@gmail.com |
Traders' Resource Links | |
| TradeSystemGuru.com has not added any product or service information to TRADERS' RESOURCE. | |
Click here for more information about our publications!
Comments

Request Information From Our Sponsors
- StockCharts.com, Inc.
- Candle Patterns
- Candlestick Charting Explained
- Intermarket Technical Analysis
- John Murphy on Chart Analysis
- John Murphy's Chart Pattern Recognition
- John Murphy's Market Message
- MurphyExplainsMarketAnalysis-Intermarket Analysis
- MurphyExplainsMarketAnalysis-Visual Analysis
- StockCharts.com
- Technical Analysis of the Financial Markets
- The Visual Investor
- VectorVest, Inc.
- Executive Premier Workshop
- One-Day Options Course
- OptionsPro
- Retirement Income Workshop
- Sure-Fire Trading Systems (VectorVest, Inc.)
- Trading as a Business Workshop
- VectorVest 7 EOD
- VectorVest 7 RealTime/IntraDay
- VectorVest AutoTester
- VectorVest Educational Services
- VectorVest OnLine
- VectorVest Options Analyzer
- VectorVest ProGraphics v6.0
- VectorVest ProTrader 7
- VectorVest RealTime Derby Tool
- VectorVest Simulator
- VectorVest Variator
- VectorVest Watchdog