

HOT TOPICS LIST
- MACD
- Fibonacci
- RSI
- Gann
- ADXR
- Stochastics
- Volume
- Triangles
- Futures
- Cycles
- Volatility
- ZIGZAG
- MESA
- Retracement
- Aroon
INDICATORS LIST
LIST OF TOPICS
PRINT THIS ARTICLE
by Matt Blackman
Between the first trading day of 2013 and the end of May, Tesla Motors Inc. enjoyed a three-bag run -- the stock was up more than 300%. But as the spring stock rally began to unravel, TSLA looked increasingly vulnerable.
Position: N/A
Matt Blackman
Matt Blackman is a full-time technical and financial writer and trader. He produces corporate and financial newsletters, and assists clients in getting published in the mainstream media. He is the host of TradeSystemGuru.com. Matt has earned the Chartered Market Technician (CMT) designation. Find out what stocks and futures Matt is watching on Twitter at www.twitter.com/RatioTrade
PRINT THIS ARTICLE
HEAD & SHOULDERS
Tesla - Is the Parabolic Run Done?
06/27/13 02:53:34 PMby Matt Blackman
Between the first trading day of 2013 and the end of May, Tesla Motors Inc. enjoyed a three-bag run -- the stock was up more than 300%. But as the spring stock rally began to unravel, TSLA looked increasingly vulnerable.
Position: N/A
| Tesla is a stock investors either love or love to hate. The shorts are most assuredly in the second group – almost every attempt to drive the stock lower has run headlong into buying pressure thanks in large part to the ability of Tesla CEO Elon Musk to attract buyers when they are needed most. Although US stocks dropped across the board on June 24, 2013, TSLA gained nearly two percent on news from the electric car manufacturer that it was launching a rapid battery exchange program at several CBL malls across the country which would allow drivers to exchange spent batteries for fully charged ones in less time than it took to fill up at a gas station. |
|
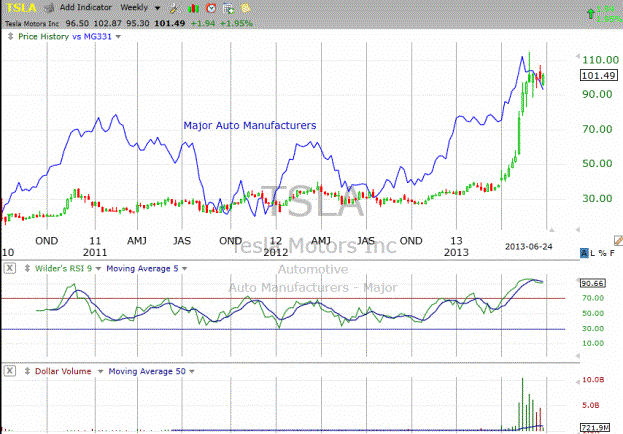
| Figure 1 � Weekly chart of TSLA showing the longer-term move from 2010 then the explosive parabolic move that began in May 2013, together with the major auto manufactures industry group to which the company belongs. |
| Graphic provided by: TC2000.com. |
| |
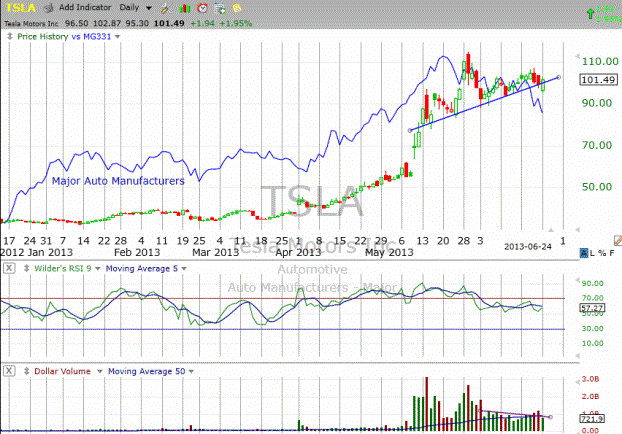
| In May alone, TSLA nearly doubled in price (Figure 1) thanks in large part to a positive stock market environment plus a few well-played news releases announcing a favorable financing program for Tesla buyers, better than expected earnings and news that the company was expanding a series of supercharging stations in late May. But the June 24 news release contained a sobering note — according to Comtex, "Tesla, which on track to build 21,000 cars this year, is worth more than Fiat and nearly a quarter as much as General Motors which has 21,000 dealers." This begs the obvious question, has TSLA moved too far too fast? First, let's look at the technical picture. As we see from Figure 2, TSLA looks to be in the process of putting in a potential bearish Head & Shoulders top with an upward sloping neckline. Its industry group – Major Auto Manufacturers – also looks to be in the process of rolling over. Also, look at the volume signature below. Volume is trending down which is bearish for a fast moving stock like TSLA especially after a parabolic move. |
|
| Figure 2 � Daily chart comparing TSLA with its industry subgroup showing the break then recent rebound through the recent Head & Shoulders neckline which is decidedly bearish. |
| Graphic provided by: TC2000.com. |
| |
| Finally, for those interested in the fundamentals, TSLA has become downright expensive compared to Ford, General Motors, Toyota and Honda. First, TSLA is the only company with a negative PE. If we look at price/sales, TSLA's $11.82 is sky-high compared to its competitors. It also has a very low share book value at $1.46 (0.0147 of its share price) compared to 0.305 for Ford, 0.58 for Toyota, 0.63 for GM and 0.76 for Honda. |
| So why has TSLA become so expensive even though it lost more than $150 million in operating cash flow last year and has no dividend yield? As with most stocks, it is based on investor expectations that the company will earn substantial profits in the future. That may happen but the question is, will it happen fast enough to keep the current investors, most of whom are institutions, happy without dividends? If the latest neckline is decisively broken to the downside, the chart will be telling us that there's a reasonable chance that it won't. |
Matt Blackman is a full-time technical and financial writer and trader. He produces corporate and financial newsletters, and assists clients in getting published in the mainstream media. He is the host of TradeSystemGuru.com. Matt has earned the Chartered Market Technician (CMT) designation. Find out what stocks and futures Matt is watching on Twitter at www.twitter.com/RatioTrade
| Company: | TradeSystemGuru.com |
| Address: | Box 2589 |
| Garibaldi Highlands, BC Canada | |
| Phone # for sales: | 604-898-9069 |
| Fax: | 604-898-9069 |
| Website: | www.tradesystemguru.com |
| E-mail address: | indextradermb@gmail.com |
Traders' Resource Links | |
| TradeSystemGuru.com has not added any product or service information to TRADERS' RESOURCE. | |
Click here for more information about our publications!
PRINT THIS ARTICLE

Request Information From Our Sponsors
- StockCharts.com, Inc.
- Candle Patterns
- Candlestick Charting Explained
- Intermarket Technical Analysis
- John Murphy on Chart Analysis
- John Murphy's Chart Pattern Recognition
- John Murphy's Market Message
- MurphyExplainsMarketAnalysis-Intermarket Analysis
- MurphyExplainsMarketAnalysis-Visual Analysis
- StockCharts.com
- Technical Analysis of the Financial Markets
- The Visual Investor
- VectorVest, Inc.
- Executive Premier Workshop
- One-Day Options Course
- OptionsPro
- Retirement Income Workshop
- Sure-Fire Trading Systems (VectorVest, Inc.)
- Trading as a Business Workshop
- VectorVest 7 EOD
- VectorVest 7 RealTime/IntraDay
- VectorVest AutoTester
- VectorVest Educational Services
- VectorVest OnLine
- VectorVest Options Analyzer
- VectorVest ProGraphics v6.0
- VectorVest ProTrader 7
- VectorVest RealTime Derby Tool
- VectorVest Simulator
- VectorVest Variator
- VectorVest Watchdog