

HOT TOPICS LIST
- MACD
- Fibonacci
- RSI
- Gann
- ADXR
- Stochastics
- Volume
- Triangles
- Futures
- Cycles
- Volatility
- ZIGZAG
- MESA
- Retracement
- Aroon
INDICATORS LIST
LIST OF TOPICS
PRINT THIS ARTICLE
by Matt Blackman
The solar sector is on the rebound but finding winners is still a challenge.
Position: N/A
Matt Blackman
Matt Blackman is a full-time technical and financial writer and trader. He produces corporate and financial newsletters, and assists clients in getting published in the mainstream media. Matt has earned the Chartered Market Technician (CMT) designation. Follow Matt on Twitter at www.twitter.com/RatioTrade
PRINT THIS ARTICLE
BULL/BEAR MARKET
Solar Rising Star?
08/19/21 04:50:33 PMby Matt Blackman
The solar sector is on the rebound but finding winners is still a challenge.
Position: N/A
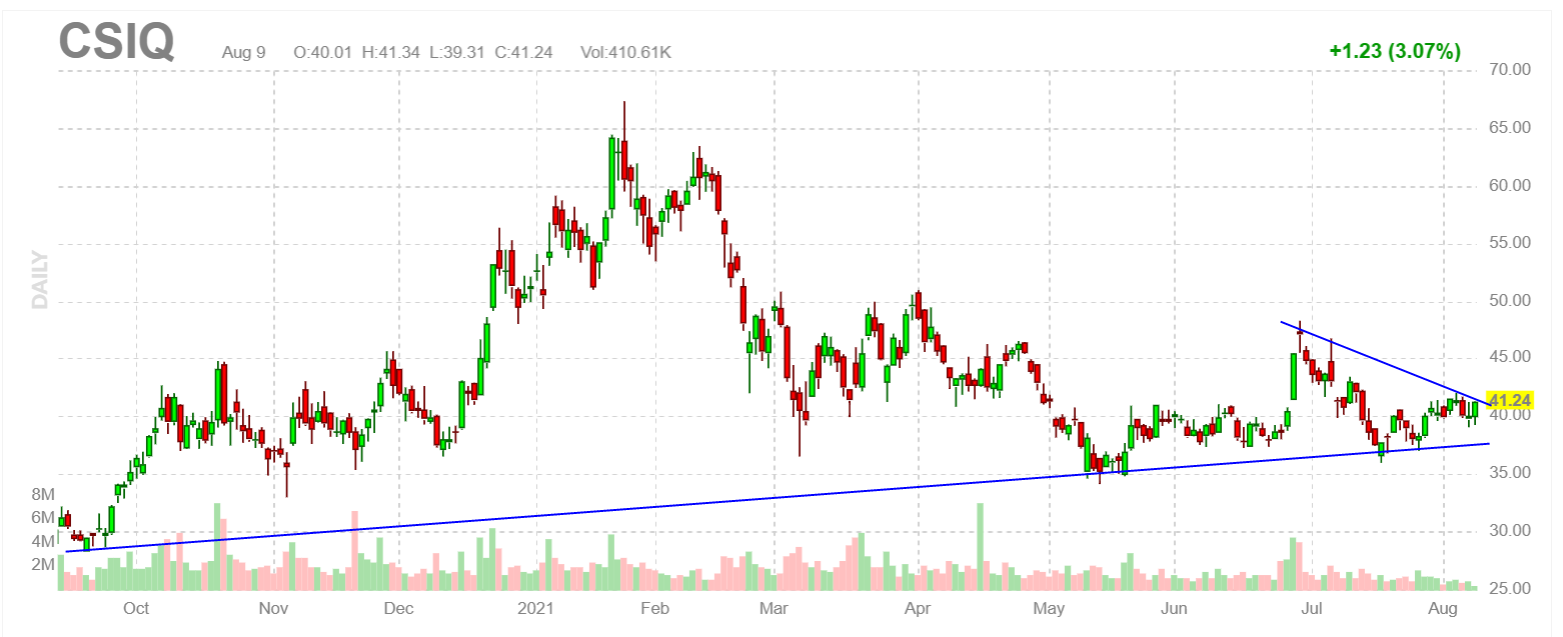
| Last year solar stocks were star performers; that is until the correction early in the New Year 2021. But after hitting their medium-term lows in May, the industry has been regaining ground. And one stock in the industry has some rather unique fundamental characteristics. Canadian Solar Inc. (CSIQ) saw its stock price get nearly cut in half between January and May this year falling from a high above $67 in January to hit a low of $34.18 on May 13. By mid-August that stock was back above $40 per share again in a rising trend. |
|
| Figure 1. Daily chart of Canadian Solar Inc. over the last year showing the October 2020 lows and January highs and uptrend support over the period. |
| Graphic provided by: https://finviz.com/. |
| |
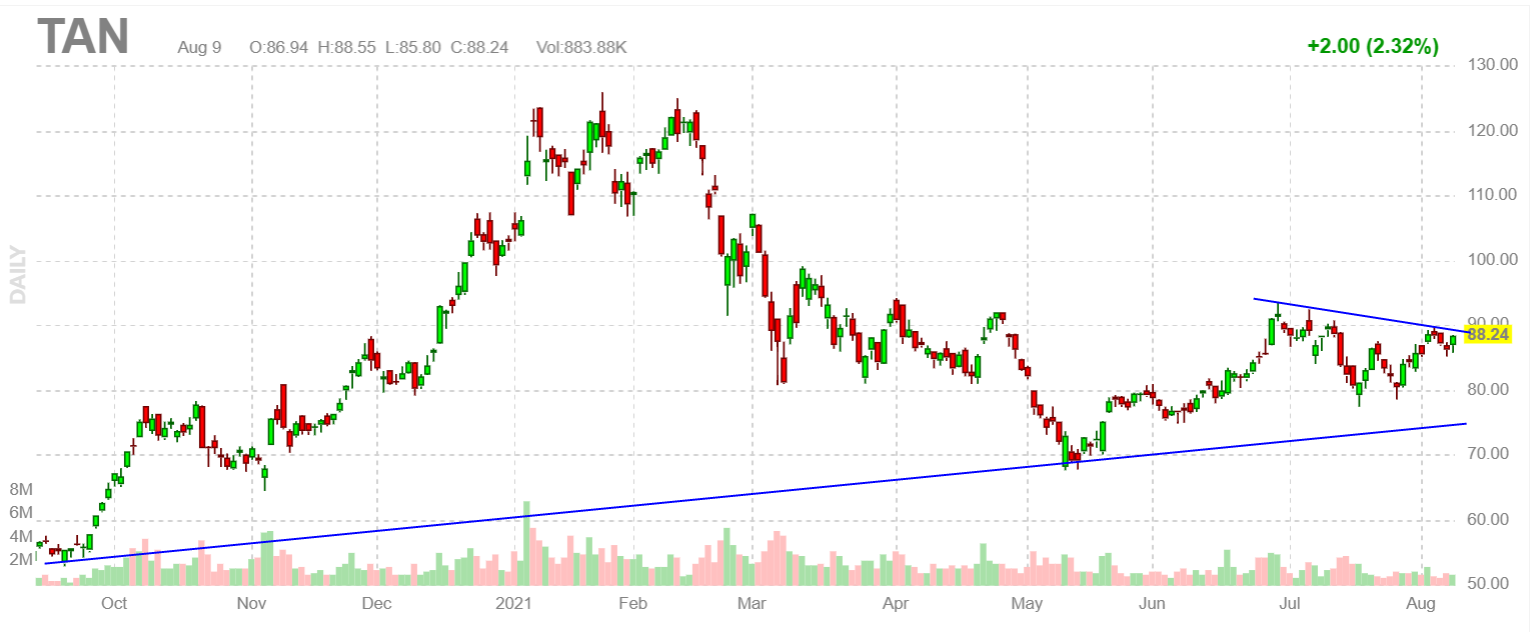
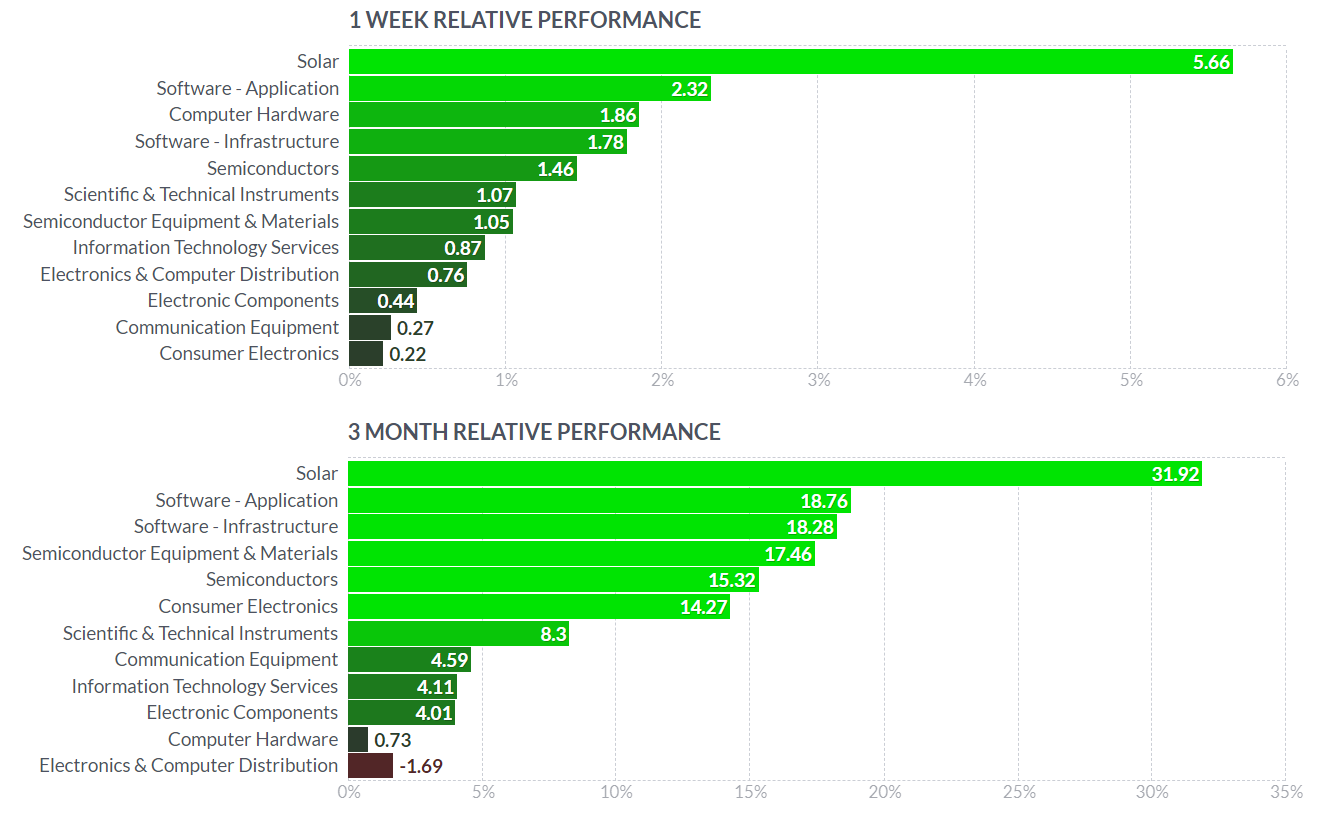
| From an industry perspective, solar is down 11.34% year-to-date. Recently it looked a lot better as we see in Figure 3 with the industry up nearly 32% in the last three months and +5.66% on the week ending August 9. As we see from Figure 2, the solar sector ETF (TAN), which is another way to trade the industry, also looks quite bullish. |
|
| Figure 2. Chart of the solar sector ETF TAN showing one-year uptrend support and what looks to be a consolidation in July and August. |
| Graphic provided by: https://finviz.com/. |
| |
| So what makes CSIQ fundamentally unique? Of 18 solar stocks, it was the only company that boasted a Price-Earnings (P/E) ratio of less than 50, a positive Forward P/E and a Price Earnings Growth (PEG) above 1. PEG is the P/E ratio divided by its growth rate over a period of generally one to three years. A PEG of 3.51 says Canadian Solar is reasonably valued and showing positive growth. |
|
| Figure 3. Performance chart of technology stocks showing solar in the lead on both a weekly and quarterly basis. |
| Graphic provided by: https://finviz.com/. |
| |
| A cautionary note is the stock market has been stuck in a strong uptrend for a while now with the S&P500 ETF (SPY) up more than 32% in the last year. A correction could come at any time especially as we approach the fall during which many of the biggest corrections and bear markets have begun. But whether it will be a brief hiccup, a flat market or the beginning of a more protracted correction remains to be seen. |
| Suggested Reading: Solar Stocks - Time To Start Shopping Again? Enphase Breaking Out |
Matt Blackman is a full-time technical and financial writer and trader. He produces corporate and financial newsletters, and assists clients in getting published in the mainstream media. Matt has earned the Chartered Market Technician (CMT) designation. Follow Matt on Twitter at www.twitter.com/RatioTrade
| Title: | Author |
| Company: | TradeSystemGuru |
| Address: | Box 2589 |
| Garibaldi Highlands, BC V0N1T0 | |
| Phone # for sales: | 6048989069 |
| E-mail address: | indextradermb@gmail.com |
Traders' Resource Links | |
| TradeSystemGuru has not added any product or service information to TRADERS' RESOURCE. | |
Click here for more information about our publications!
PRINT THIS ARTICLE

Request Information From Our Sponsors
- VectorVest, Inc.
- Executive Premier Workshop
- One-Day Options Course
- OptionsPro
- Retirement Income Workshop
- Sure-Fire Trading Systems (VectorVest, Inc.)
- Trading as a Business Workshop
- VectorVest 7 EOD
- VectorVest 7 RealTime/IntraDay
- VectorVest AutoTester
- VectorVest Educational Services
- VectorVest OnLine
- VectorVest Options Analyzer
- VectorVest ProGraphics v6.0
- VectorVest ProTrader 7
- VectorVest RealTime Derby Tool
- VectorVest Simulator
- VectorVest Variator
- VectorVest Watchdog
- StockCharts.com, Inc.
- Candle Patterns
- Candlestick Charting Explained
- Intermarket Technical Analysis
- John Murphy on Chart Analysis
- John Murphy's Chart Pattern Recognition
- John Murphy's Market Message
- MurphyExplainsMarketAnalysis-Intermarket Analysis
- MurphyExplainsMarketAnalysis-Visual Analysis
- StockCharts.com
- Technical Analysis of the Financial Markets
- The Visual Investor