

HOT TOPICS LIST
- MACD
- Fibonacci
- RSI
- Gann
- ADXR
- Stochastics
- Volume
- Triangles
- Futures
- Cycles
- Volatility
- ZIGZAG
- MESA
- Retracement
- Aroon
INDICATORS LIST
LIST OF TOPICS
PRINT THIS ARTICLE
by Matt Blackman
Markets have been volatile but is the worst over for solar stocks? And which ones are best positioned to perform once the correction has run its course?
Position: N/A
Matt Blackman
Matt Blackman is a full-time technical and financial writer and trader. He produces corporate and financial newsletters, and assists clients in getting published in the mainstream media. Matt has earned the Chartered Market Technician (CMT) designation. Follow Matt on Twitter at www.twitter.com/RatioTrade
PRINT THIS ARTICLE
RISING TREND
Solar Stocks - Time To Start Shopping Again?
04/22/21 04:36:22 PMby Matt Blackman
Markets have been volatile but is the worst over for solar stocks? And which ones are best positioned to perform once the correction has run its course?
Position: N/A
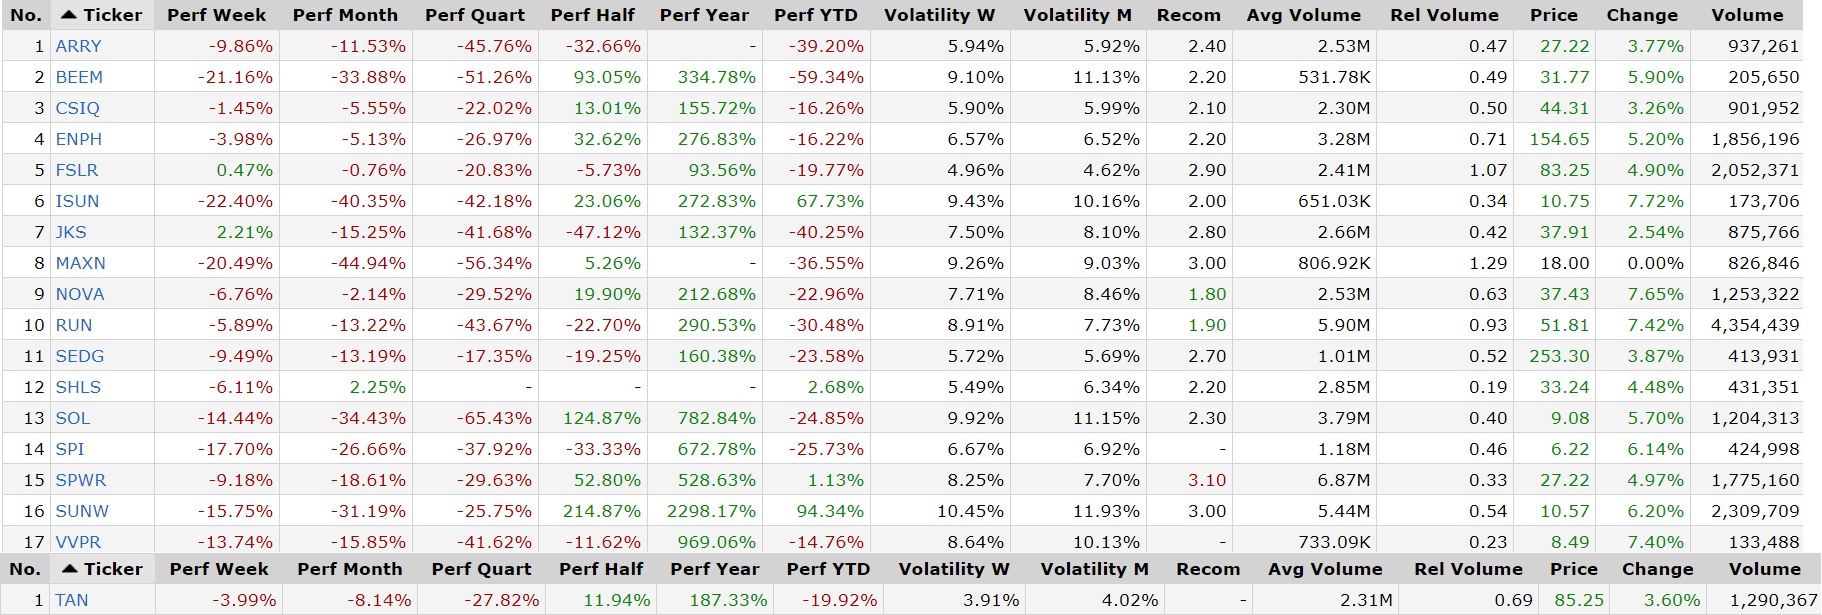
| On the one hand, solar stocks have had a great year overall even after the reversal in February 2021. Over the last 12 months, bellwether Solar ETF TAN was up more than 187% even after the quarterly loss of 28%, losing over 8% in the last month alone. Of the 17 stocks in the solar industry just one — newcomer Shoals Technologies — gained ground in the month, albeit barely (see article below). |
|
| Figure 1. Table comparing solar industry performance with the Solar ETF TAN to April 21. |
| Graphic provided by: https://finviz.com/. |
| |
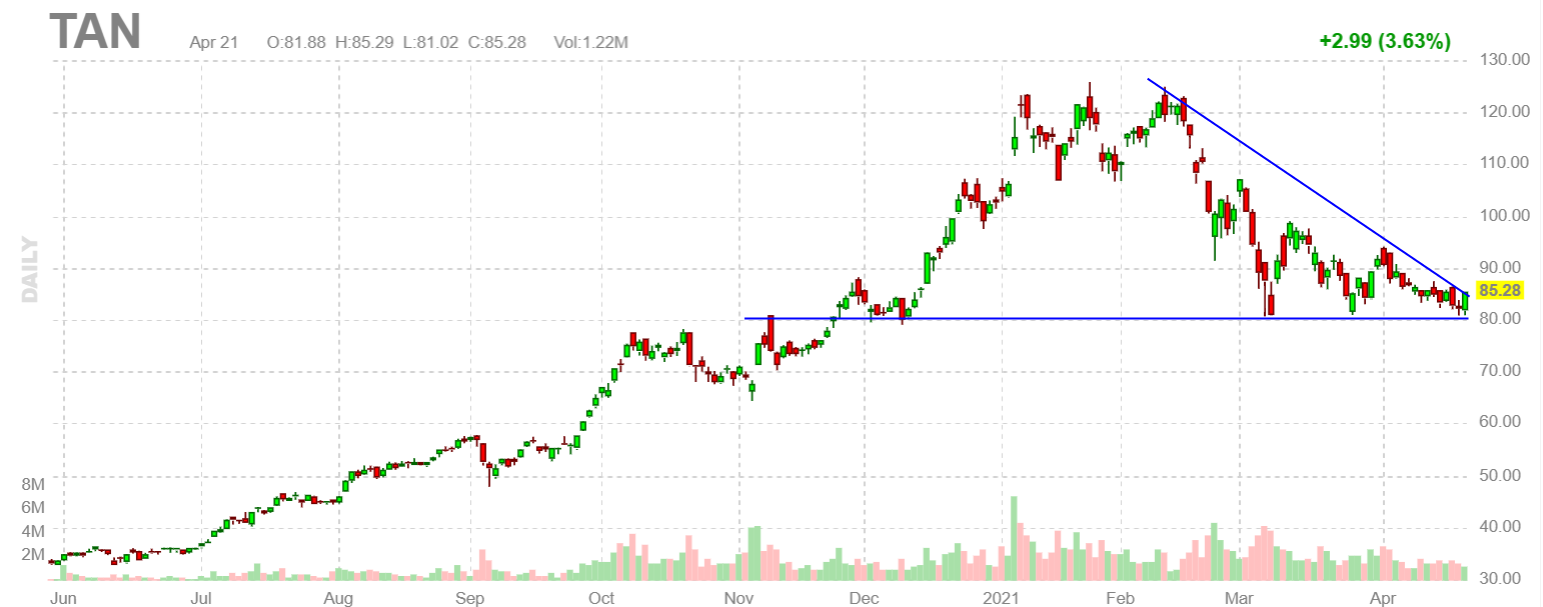
| Not surprisingly, stocks that soared the highest in the last year such as SunWorks (SUNW), up 2300%, got hit hard in the last month. But looking forward, there are signs that the sun may be getting ready to shine on the industry again. As we see from the chart of TAN (Figure 2), there is strong support around $80 which forms support of the descending triangle pattern. A break above the down sloping pattern top trendline on above average volume would signal a potential buy. |
|
| Figure 2. Daily chart of Solar ETF TAN showing a descending triangle chart pattern that would be bullish if broken to the upside on bullish volume. |
| Graphic provided by: https://finviz.com/. |
| |
| Fundamentally, the solar list gets quickly parsed when searching for stocks making a profit. In fact, when limited to companies with positive trailing and forward P/Es and positive EPS growth, just two survive. Add the requirement of a gross margin of 15% or more and just one — First Solar — is left with a margin of 25.1%. |

|
| Figure 3 � Table comparing financial metrics for FSLR and SWPR. |
| Graphic provided by: https://finviz.com/. |
| |
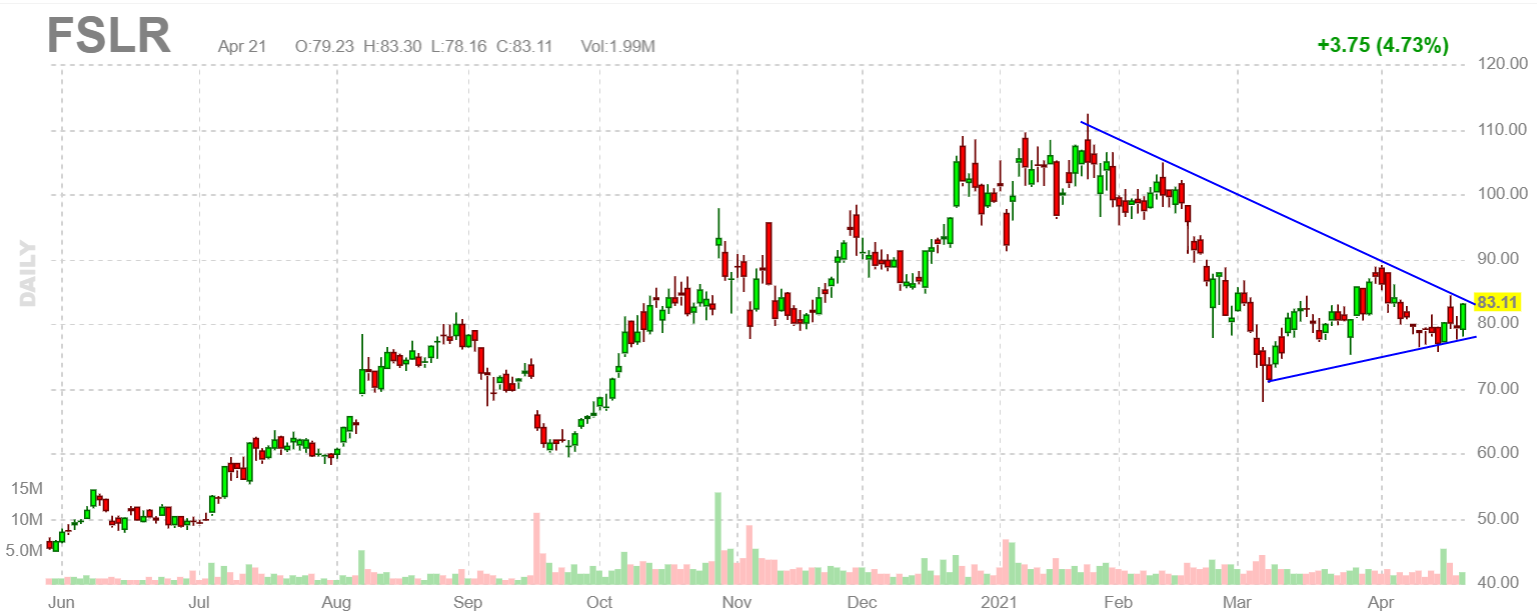
| In any correction, there is the ever present desire to pick a bottom and breakout point. The big challenge is that one will never know a true bottom has formed until after the fact and the stock begins a rally two-step of high lows and higher highs on rising volume. At this point, First Solar is a solar performance leader with the most bullish chart. A buy should only occur in conjunction with a written trading plan with firm stop loss and profit target levels. As always, if support is broken, best to exit and wait for a better opportunity. |
|
| Figure 4. Daily chart of First Solar showing the bullish asymmetrical triangle with imminent breakout (or breakdown.) |
| Graphic provided by: https://finviz.com/. |
| |
| Suggested Reading: Shoals Technologies - The New Solar Kid In Town First Solar - A Time To Buy? |
Matt Blackman is a full-time technical and financial writer and trader. He produces corporate and financial newsletters, and assists clients in getting published in the mainstream media. Matt has earned the Chartered Market Technician (CMT) designation. Follow Matt on Twitter at www.twitter.com/RatioTrade
| Title: | Author |
| Company: | TradeSystemGuru |
| Address: | Box 2589 |
| Garibaldi Highlands, BC V0N1T0 | |
| Phone # for sales: | 6048989069 |
| E-mail address: | indextradermb@gmail.com |
Traders' Resource Links | |
| TradeSystemGuru has not added any product or service information to TRADERS' RESOURCE. | |
Click here for more information about our publications!
PRINT THIS ARTICLE

Request Information From Our Sponsors
- StockCharts.com, Inc.
- Candle Patterns
- Candlestick Charting Explained
- Intermarket Technical Analysis
- John Murphy on Chart Analysis
- John Murphy's Chart Pattern Recognition
- John Murphy's Market Message
- MurphyExplainsMarketAnalysis-Intermarket Analysis
- MurphyExplainsMarketAnalysis-Visual Analysis
- StockCharts.com
- Technical Analysis of the Financial Markets
- The Visual Investor
- VectorVest, Inc.
- Executive Premier Workshop
- One-Day Options Course
- OptionsPro
- Retirement Income Workshop
- Sure-Fire Trading Systems (VectorVest, Inc.)
- Trading as a Business Workshop
- VectorVest 7 EOD
- VectorVest 7 RealTime/IntraDay
- VectorVest AutoTester
- VectorVest Educational Services
- VectorVest OnLine
- VectorVest Options Analyzer
- VectorVest ProGraphics v6.0
- VectorVest ProTrader 7
- VectorVest RealTime Derby Tool
- VectorVest Simulator
- VectorVest Variator
- VectorVest Watchdog