

HOT TOPICS LIST
- MACD
- Fibonacci
- RSI
- Gann
- ADXR
- Stochastics
- Volume
- Triangles
- Futures
- Cycles
- Volatility
- ZIGZAG
- MESA
- Retracement
- Aroon
INDICATORS LIST
LIST OF TOPICS
PRINT THIS ARTICLE
by Matt Blackman
Solar headwinds have hit the sector. Have they blown themselves out?
Position: N/A
Matt Blackman
Matt Blackman is a full-time technical and financial writer and trader. He produces corporate and financial newsletters, and assists clients in getting published in the mainstream media. Matt has earned the Chartered Market Technician (CMT) designation. Follow Matt on Twitter at www.twitter.com/RatioTrade
PRINT THIS ARTICLE
WILDER'S RSI
First Solar - A Time To Buy?
03/04/21 04:16:23 PMby Matt Blackman
Solar headwinds have hit the sector. Have they blown themselves out?
Position: N/A
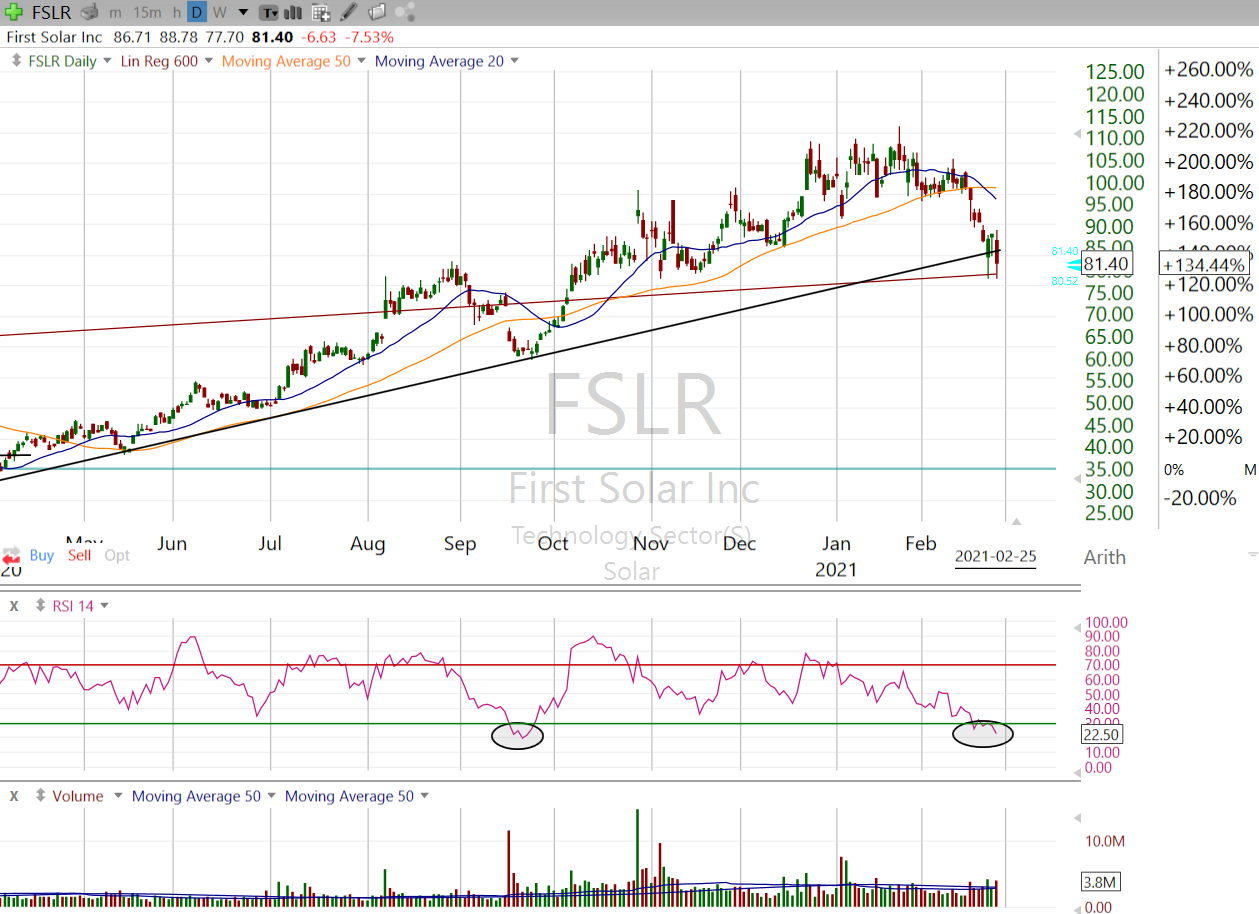
| First Solar Inc, "a leading global provider of comprehensive photovoltaic ("PV") solar solutions" according to its website, has enjoyed a good stock run along with many other green energy and technology companies. But as we see in Figure 1, the stock suffered a 25% correction between January 25 and February 25. But there are some compelling reasons why this could be a good time to pick up some shares. |
|
| Figure 1. Daily chart of FSLR showing trendline support, linear regression line showing fair value and times when the stock has been a technical buy (see ovals). |
| Graphic provided by: Freestockcharts.com. |
| |
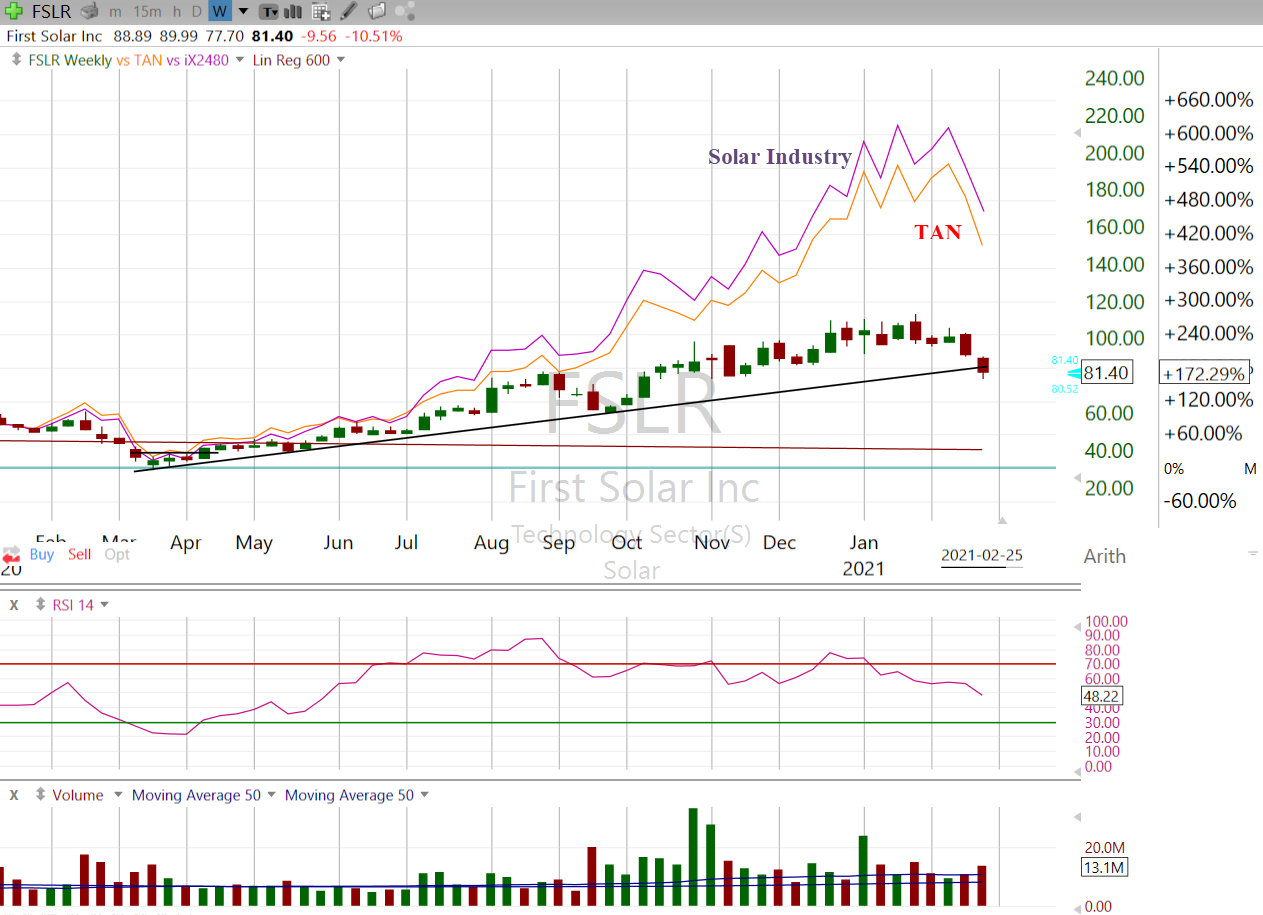
| As we see from the 14-day Relative Strength Index (RSI), the last time the stock was below 30 RSI, it experienced an impressive run shortly thereafter. It is back in buy territory again for the first time since September 2020. And as we see from Figure 2, it has been underperforming both the Solar Industry and Solar ETF (TAN). Finally, not only is it again sitting on medium-term trendline support, it is back to its 600-day linear regression line price, which is an indicator of fair value. Fundamentally, FSLR is a mixed bag. Although it lost $1.09 per share for the year ending December 2020, in its latest quarterly financial report (09-2020) earnings per share (EPS) increased from $0.29 to $1.45, on revenues of $927.6 million (up from $546.8 million). Sixty-eight percent of shares are held by institutions and FSLR currently boasts a rather modest trailing PE of 31.4 times compared to SolarEdge (SEDG) of 114.38 and 953 times for Tesla (TSLA). |
|
| Figure 2. Weekly FSLR chart comparing its performance to the solar industry (purple) and Solar ETF (TAN) in red since January 2020. |
| Graphic provided by: Freestockcharts.com. |
| |
| But the question remains as to where it goes from here. If FSLR support around $80 can hold and we see a confirmed technical buy signal such as the RSI (14) turning back above 30 in Figure 1 on rising buying volume, this could be a good place to pick up more shares. The flip-side is that if current support breaks, especially on rising selling volume or tech stocks take another leg down, it might be best to step back and wait for a new set up and buy trigger. |
| Suggested Reading: First Solar Website Shoals Technologies - The New Solar Kid In Town First Solar Financial Statement Summary - Macrotrends |
Matt Blackman is a full-time technical and financial writer and trader. He produces corporate and financial newsletters, and assists clients in getting published in the mainstream media. Matt has earned the Chartered Market Technician (CMT) designation. Follow Matt on Twitter at www.twitter.com/RatioTrade
| Title: | Author |
| Company: | TradeSystemGuru |
| Address: | Box 2589 |
| Garibaldi Highlands, BC V0N1T0 | |
| Phone # for sales: | 6048989069 |
| E-mail address: | indextradermb@gmail.com |
Traders' Resource Links | |
| TradeSystemGuru has not added any product or service information to TRADERS' RESOURCE. | |
Click here for more information about our publications!
PRINT THIS ARTICLE

Request Information From Our Sponsors
- StockCharts.com, Inc.
- Candle Patterns
- Candlestick Charting Explained
- Intermarket Technical Analysis
- John Murphy on Chart Analysis
- John Murphy's Chart Pattern Recognition
- John Murphy's Market Message
- MurphyExplainsMarketAnalysis-Intermarket Analysis
- MurphyExplainsMarketAnalysis-Visual Analysis
- StockCharts.com
- Technical Analysis of the Financial Markets
- The Visual Investor
- VectorVest, Inc.
- Executive Premier Workshop
- One-Day Options Course
- OptionsPro
- Retirement Income Workshop
- Sure-Fire Trading Systems (VectorVest, Inc.)
- Trading as a Business Workshop
- VectorVest 7 EOD
- VectorVest 7 RealTime/IntraDay
- VectorVest AutoTester
- VectorVest Educational Services
- VectorVest OnLine
- VectorVest Options Analyzer
- VectorVest ProGraphics v6.0
- VectorVest ProTrader 7
- VectorVest RealTime Derby Tool
- VectorVest Simulator
- VectorVest Variator
- VectorVest Watchdog