HOT TOPICS LIST
- MACD
- Fibonacci
- RSI
- Gann
- ADXR
- Stochastics
- Volume
- Triangles
- Futures
- Cycles
- Volatility
- ZIGZAG
- MESA
- Retracement
- Aroon
INDICATORS LIST
LIST OF TOPICS
PRINT THIS ARTICLE
by Matt Blackman
"Oh how the mighty have fallen"
Position: N/A
Matt Blackman
Matt Blackman is a full-time technical and financial writer and trader. He produces corporate and financial newsletters, and assists clients in getting published in the mainstream media. Matt has earned the Chartered Market Technician (CMT) designation. Follow Matt on Twitter at www.twitter.com/RatioTrade
PRINT THIS ARTICLE
HEAD & SHOULDERS
After Moon Shot Lumber Falls Back To Earth
08/05/21 04:56:16 PMby Matt Blackman
"Oh how the mighty have fallen"
Position: N/A
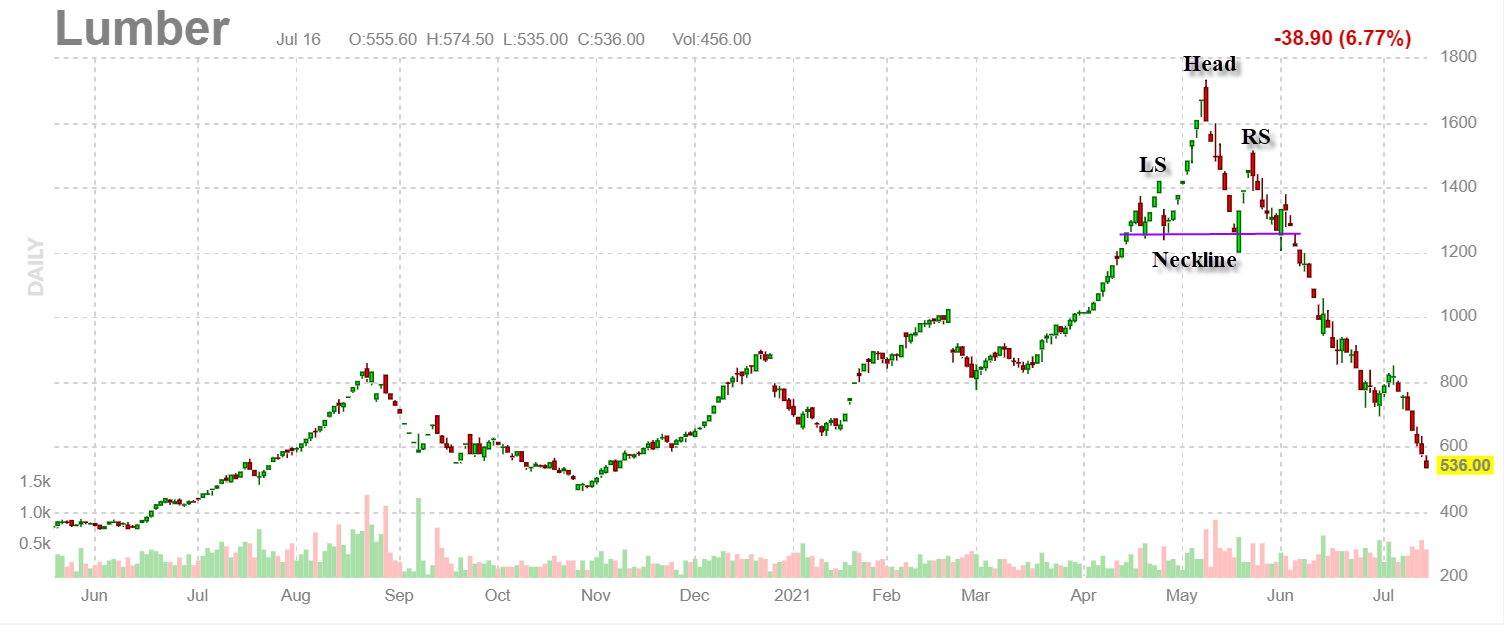
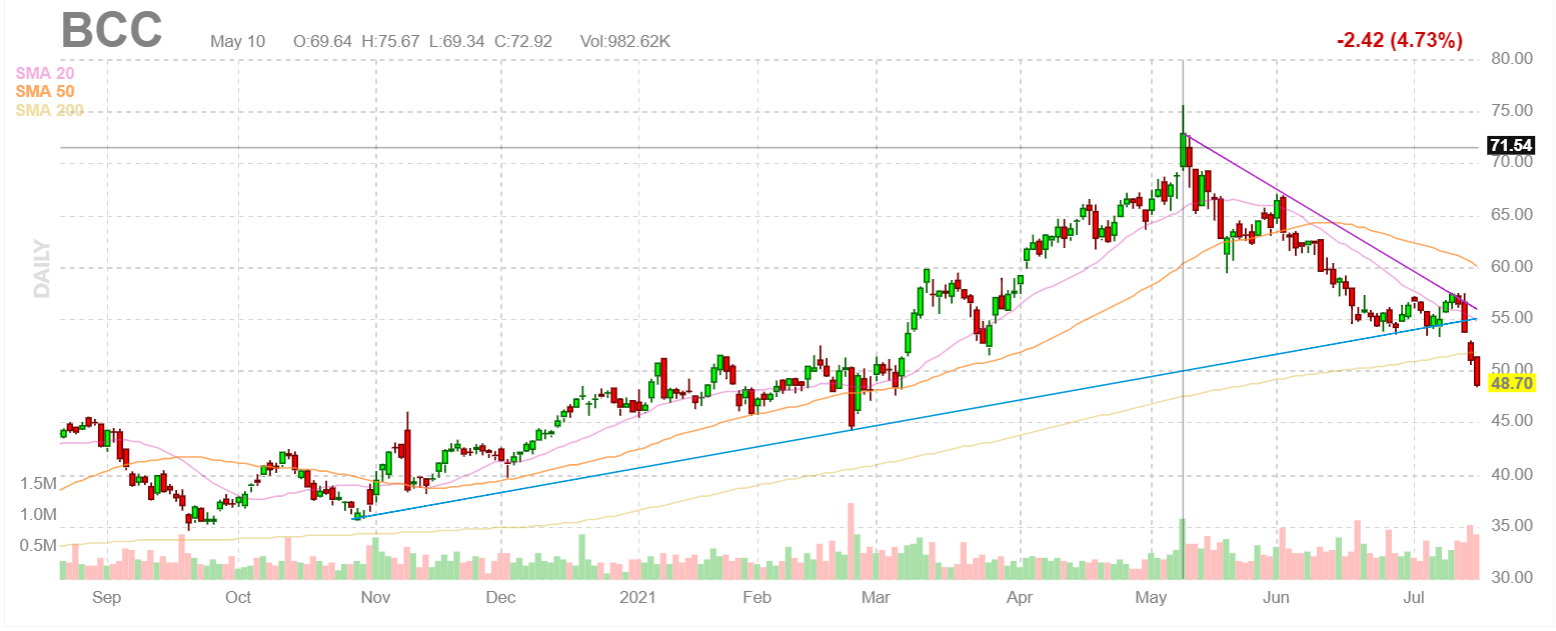
| Hard to believe that a little more than two months ago lumber futures were trading north of $1750. In just over a year, the building material gained more than 590% from an early April 2020 low of $251.50 and in the process saw the building industry turn from robust to moribund as home buyers, builders and renovators struggled under rising prices. Ultimately these rises strangled the market as buyers quickly evaporated and contracts were cancelled. Near the peak, lumber material producer Boise Cascade Company saw its Price/Earnings ratio rise above 16 times earnings. By mid-July it has dropped to 6.18 as the stock dropped more than 35% from its high. And like lumber futures, the stock price showed no sign of stabilizing. |

|
| Figure 1. After hitting a low of $251.50 during the week of April 3, Lumber futures soared to hit a high of $1733.50 May 10. It closed at $636.00 on July 16, 2021. |
| Graphic provided by: https://finviz.com/. |
| |
| As discussed in Bubblenomics (see link below), lumber cost $234 per thousand board feet in April 2020. By May 5, 2021 that cost had soared to $1635 per thousand bf — a 700% increase! To put this gain in perspective, the cost of lumber to build 14.74 homes now built just 2.11 homes. According to an April 28, 2021 report from the National Association of Home Builders (NAHB), the average cost to build a new single family home soared $35,872 and was up $13,000 for the average multifamily unit over the prior 12 months (see article below). Is it any wonder that perspective home buyers cancelled building contracts after being slapped with additional costs? |

|
| Figure 2. Lumber producer Boise Cascade hit a high of $75.67 per share on May 10. As we see from the chart, it broke long-term uptrend support (blue line) and continued falling in mid-July. |
| Graphic provided by: https://finviz.com/. |
| |
| From a technical perspective, lumber saw prices go parabolic then reverse which in the process generated a classic Head & Shoulders pattern with a neckline of 1265. Taking the difference between the peak and neckline, the pattern projected a first target of $797; a level that was decisively breached with ease on July 8. The double whammy of market bubbles is that they inflate much higher than expected. The flip side is that once pricked, they deflate much more than traders and investors expect as well, which is why they are so challenging to trade. But this drop is certainly good news for the housing market. After a 70% price drop, lumber now costs about what it did back in November 2020. How much lower prices will go is anyone's guess. |
| Suggested Reading: Bubblenomics - A Textbook Example? Cranking Up the Money Tree Skyrocketing Lumber Prices Add Nearly $36,000 to New Home Prices - NAHB |
Matt Blackman is a full-time technical and financial writer and trader. He produces corporate and financial newsletters, and assists clients in getting published in the mainstream media. Matt has earned the Chartered Market Technician (CMT) designation. Follow Matt on Twitter at www.twitter.com/RatioTrade
| Title: | Author |
| Company: | TradeSystemGuru |
| Address: | Box 2589 |
| Garibaldi Highlands, BC V0N1T0 | |
| Phone # for sales: | 6048989069 |
| E-mail address: | indextradermb@gmail.com |
Traders' Resource Links | |
| TradeSystemGuru has not added any product or service information to TRADERS' RESOURCE. | |
Click here for more information about our publications!
PRINT THIS ARTICLE

Request Information From Our Sponsors
- StockCharts.com, Inc.
- Candle Patterns
- Candlestick Charting Explained
- Intermarket Technical Analysis
- John Murphy on Chart Analysis
- John Murphy's Chart Pattern Recognition
- John Murphy's Market Message
- MurphyExplainsMarketAnalysis-Intermarket Analysis
- MurphyExplainsMarketAnalysis-Visual Analysis
- StockCharts.com
- Technical Analysis of the Financial Markets
- The Visual Investor
- VectorVest, Inc.
- Executive Premier Workshop
- One-Day Options Course
- OptionsPro
- Retirement Income Workshop
- Sure-Fire Trading Systems (VectorVest, Inc.)
- Trading as a Business Workshop
- VectorVest 7 EOD
- VectorVest 7 RealTime/IntraDay
- VectorVest AutoTester
- VectorVest Educational Services
- VectorVest OnLine
- VectorVest Options Analyzer
- VectorVest ProGraphics v6.0
- VectorVest ProTrader 7
- VectorVest RealTime Derby Tool
- VectorVest Simulator
- VectorVest Variator
- VectorVest Watchdog
