

HOT TOPICS LIST
- MACD
- Fibonacci
- RSI
- Gann
- ADXR
- Stochastics
- Volume
- Triangles
- Futures
- Cycles
- Volatility
- ZIGZAG
- MESA
- Retracement
- Aroon
INDICATORS LIST
LIST OF TOPICS
PRINT THIS ARTICLE
by Matt Blackman
"For as long as markets have existed, bubbles have formed. And whenever one of those bubbles begins to leak, it typically needs years to deflate, causing enormous economic damage as it does." David Leonhardt, NY Times September 2008.
Position: N/A
Matt Blackman
Matt Blackman is a full-time technical and financial writer and trader. He produces corporate and financial newsletters, and assists clients in getting published in the mainstream media. Matt has earned the Chartered Market Technician (CMT) designation. Follow Matt on Twitter at www.twitter.com/RatioTrade
PRINT THIS ARTICLE
VOLATILITY
Bubblenomics - A Textbook Example?
05/20/21 04:30:01 PMby Matt Blackman
"For as long as markets have existed, bubbles have formed. And whenever one of those bubbles begins to leak, it typically needs years to deflate, causing enormous economic damage as it does." David Leonhardt, NY Times September 2008.
Position: N/A
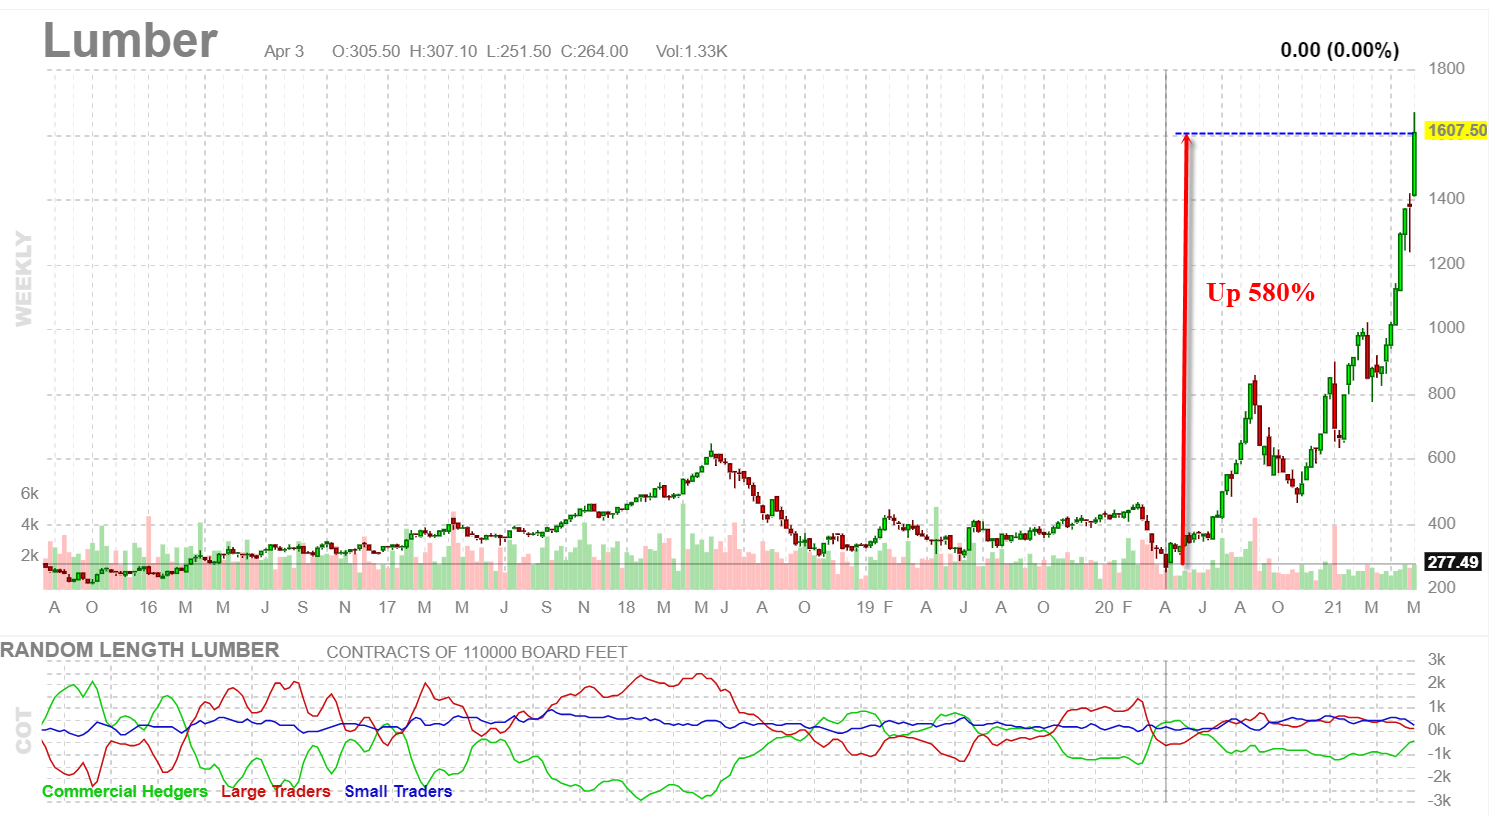
| It seems everywhere you look, prices have gone crazy. Just ask anyone who has tried to buy a boat, RV, land, house or recreational equipment. A number of stock groups also joined the party (see What Is Driving Stock Prices Into The Stratosphere?). It all began with the first Covid-19 lockdowns. No longer able to travel, folks switched to what they could do at, or near, home. Squeezed by burgeoning demand, cheap money and dwindling supply, shelves for a multitude of products were quickly stripped bare as the Federal Reserve kicked the printing presses into overdrive (see "Cranking Up the Money Tree" below). Lumber has been a big beneficiary. As we see in Figure 1, lumber is up nearly 600% from April 2020 when costs were about where they were in 2015. Then lumber cost $234 per thousand board feet. By May 5, 2021 that cost had soared to $1635 per thousand bf — a 700% increase! Put another way, the cost of lumber to build 14.74 homes now built just 2.11 homes, according to Visual Capitalist. |
|
| Figure 1. Weekly chart of lumber futures between 2015 and May 9, 2021. |
| Graphic provided by: https://finviz.com/. |
| |
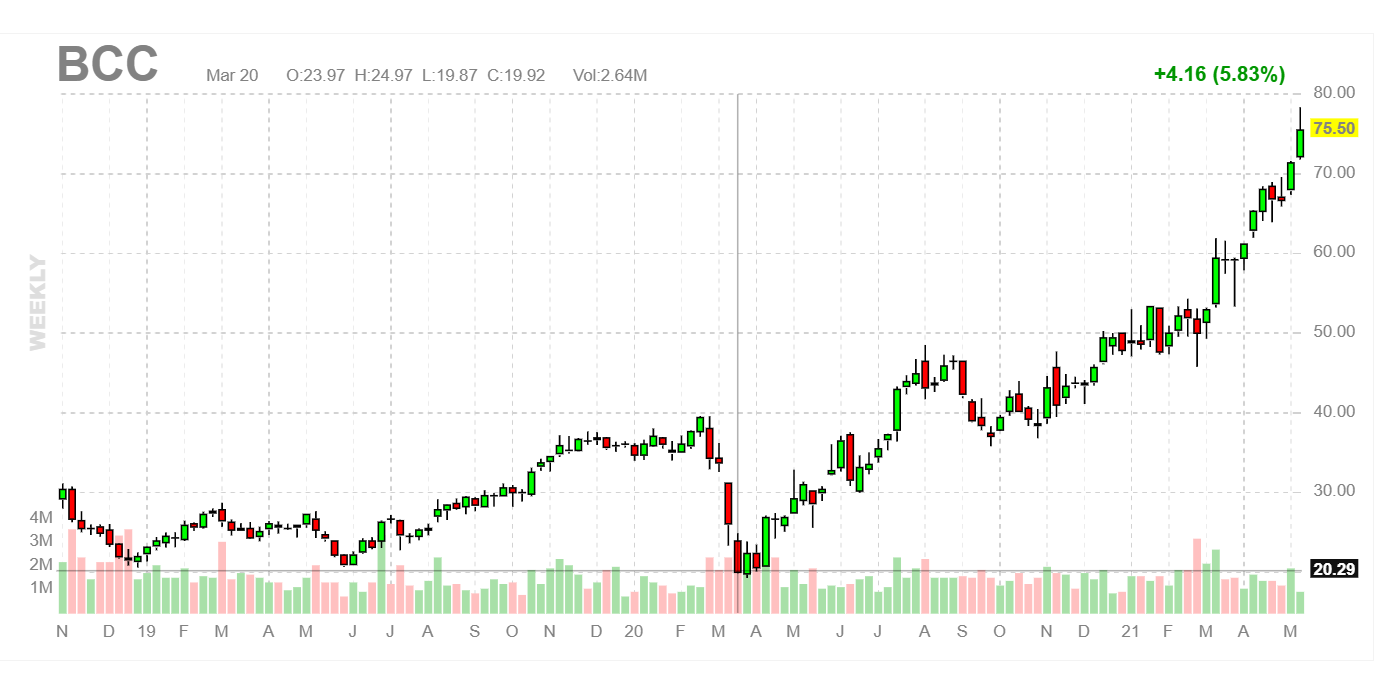
| How have lumber stocks performed? One of the top performers is Boise Cascade Company which broke above $70 on May 7. As we see from Figure 3 it is up more than 200% for the year, well above the average 122% for the industry. |
|
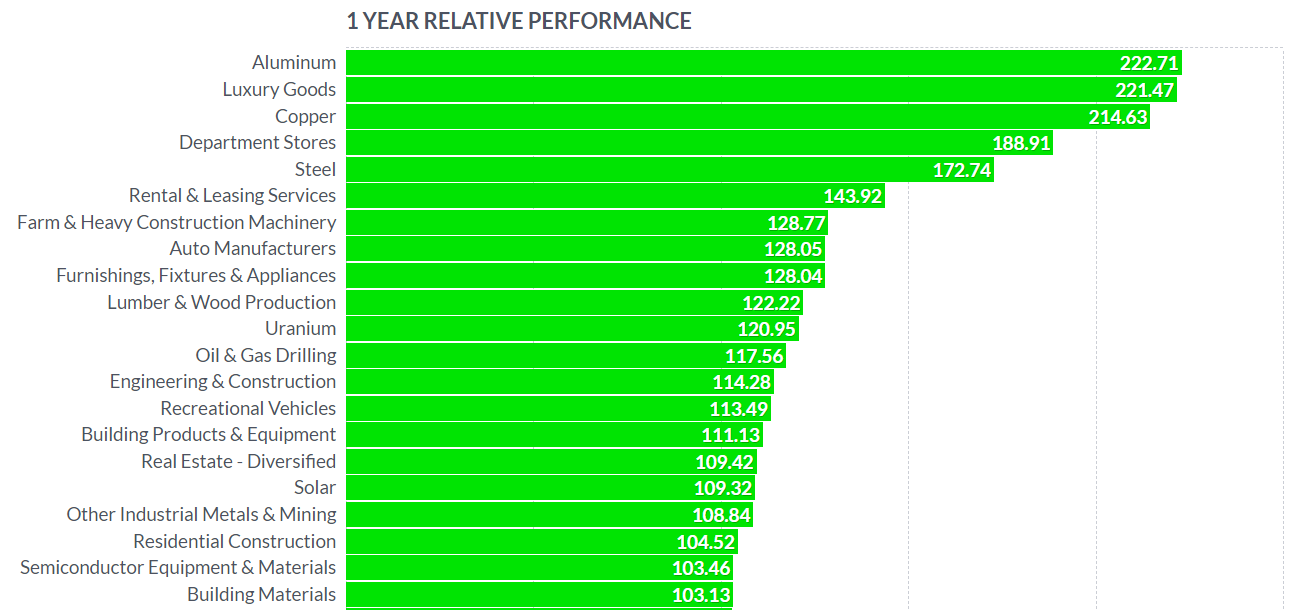
| Figure 2. Chart of the best performing industries based on yearly performance. As we see Lumber & Wood Production in 10th spot and Building Materials at number 21 have not been the only fiscal policy beneficiaries. |
| Graphic provided by: https://finviz.com/. |
| |
| But are we seeing a parabolic blowoff to be followed by big drops when it pops? Boise currently has a trailing PE of 16.10 and forward PE 16.27 which doesn't seem high compared to the current PE of 44.5 for the S&P500. The bigger question is what impact huge lumber price increases will have on construction. Not since 2004-5 have we witnessed such massive price increases in an industry that is so vital to our economy. |
|
| Figure 3. Weekly chart of Lumber company Boise Cascade Company, up 235% in the last year alone. |
| Graphic provided by: https://finviz.com/. |
| |
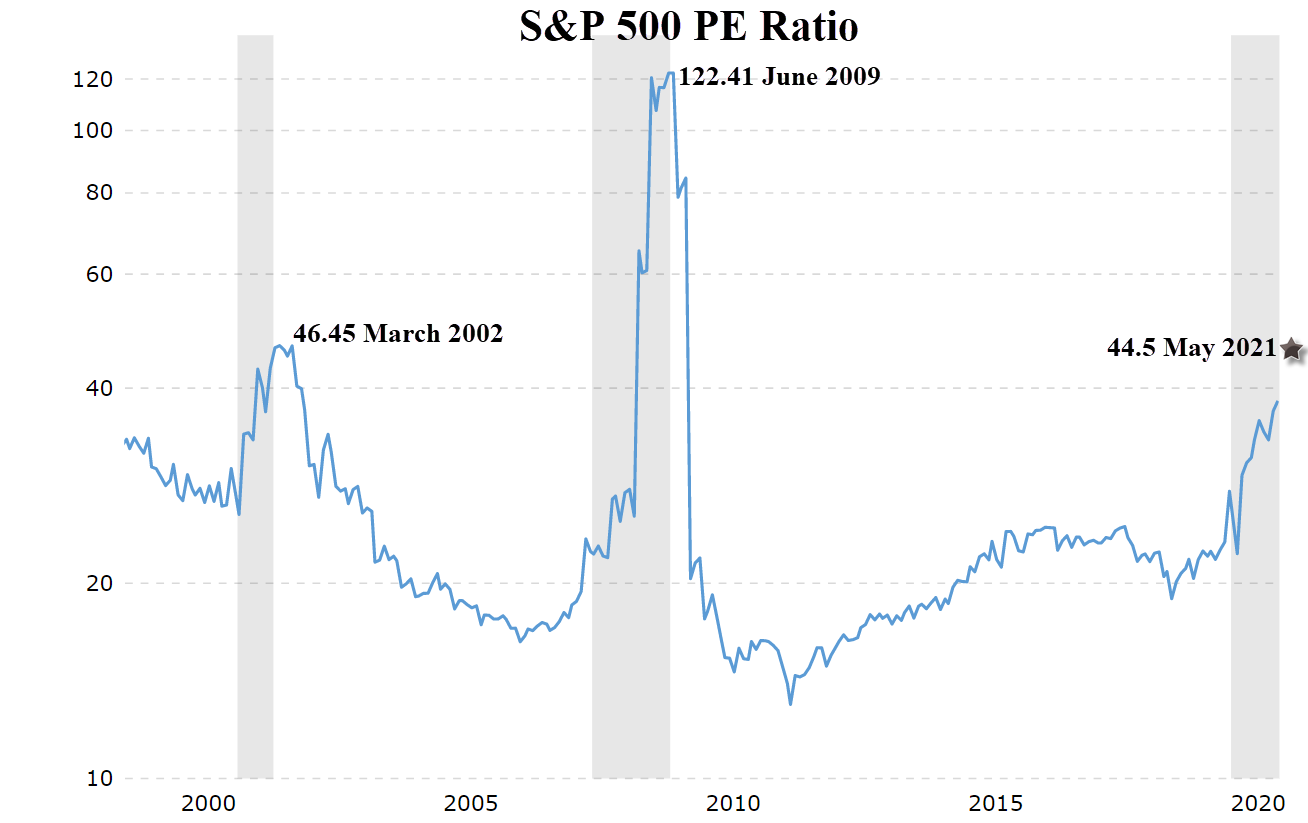
| In September 2008 when Bubblenomics was written, Wall Street firm Lehman Brothers had already gone bankrupt and Merrill Lynch had agreed to be purchased narrowly avoiding bankruptcy, as did Bear Sterns as shares dropped to a low of $2 earlier in the year. By October 2008, the Dow Jones Industrial Average had already shed more than 6,000 from its 2007 high and would lose nearly 3,000 points more before hitting bottom in February 2009. But as we see from Figure 4, the peak in the S&P P/E of 122 didn't occur until June 2009, well after the market collapse and four months into the next recovery. The moral is the hardest lesson to learn in a strong bull market is when to keep your hands off the buy button and go into defensive mode. From a trading prospective, the largest gains come during rapidly rising markets in which momentum players make their money. A system that uses a trailing stop to capture profits is essential especially when a stock reverses direction. |
|
| Figure 4. Chart of the Standard & Poor�s 500 Price/Earnings ratio to December 2020. As of May 10, 2021, the PE was 44.50. |
| Graphic provided by: https://www.macrotrends.net/. |
| |
| Suggested Reading: Bubblenomics What Is Driving Stock Prices Into The Stratosphere? Visualizing the Recent Explosion in Lumber Prices Cranking Up The Money Tree |
Matt Blackman is a full-time technical and financial writer and trader. He produces corporate and financial newsletters, and assists clients in getting published in the mainstream media. Matt has earned the Chartered Market Technician (CMT) designation. Follow Matt on Twitter at www.twitter.com/RatioTrade
| Title: | Author |
| Company: | TradeSystemGuru |
| Address: | Box 2589 |
| Garibaldi Highlands, BC V0N1T0 | |
| Phone # for sales: | 6048989069 |
| E-mail address: | indextradermb@gmail.com |
Traders' Resource Links | |
| TradeSystemGuru has not added any product or service information to TRADERS' RESOURCE. | |
Click here for more information about our publications!
PRINT THIS ARTICLE

Request Information From Our Sponsors
- StockCharts.com, Inc.
- Candle Patterns
- Candlestick Charting Explained
- Intermarket Technical Analysis
- John Murphy on Chart Analysis
- John Murphy's Chart Pattern Recognition
- John Murphy's Market Message
- MurphyExplainsMarketAnalysis-Intermarket Analysis
- MurphyExplainsMarketAnalysis-Visual Analysis
- StockCharts.com
- Technical Analysis of the Financial Markets
- The Visual Investor
- VectorVest, Inc.
- Executive Premier Workshop
- One-Day Options Course
- OptionsPro
- Retirement Income Workshop
- Sure-Fire Trading Systems (VectorVest, Inc.)
- Trading as a Business Workshop
- VectorVest 7 EOD
- VectorVest 7 RealTime/IntraDay
- VectorVest AutoTester
- VectorVest Educational Services
- VectorVest OnLine
- VectorVest Options Analyzer
- VectorVest ProGraphics v6.0
- VectorVest ProTrader 7
- VectorVest RealTime Derby Tool
- VectorVest Simulator
- VectorVest Variator
- VectorVest Watchdog