HOT TOPICS LIST
- MACD
- Fibonacci
- RSI
- Gann
- ADXR
- Stochastics
- Volume
- Triangles
- Futures
- Cycles
- Volatility
- ZIGZAG
- MESA
- Retracement
- Aroon
INDICATORS LIST
LIST OF TOPICS
PRINT THIS ARTICLE
by Matt Blackman
Covid changed the world forever. Can we print enough money to fix it? And what does it mean for stocks?
Position: N/A
Matt Blackman
Matt Blackman is a full-time technical and financial writer and trader. He produces corporate and financial newsletters, and assists clients in getting published in the mainstream media. Matt has earned the Chartered Market Technician (CMT) designation. Follow Matt on Twitter at www.twitter.com/RatioTrade
PRINT THIS ARTICLE
STANDARD DEVIATION
Cranking Up The Money Tree
08/27/20 05:38:38 PMby Matt Blackman
Covid changed the world forever. Can we print enough money to fix it? And what does it mean for stocks?
Position: N/A
| "The United States can pay any debt it has because we can always print money to do that. So there is zero probability of default." Former Fed Chairman Alan Greenspan August 8, 2011 |

|
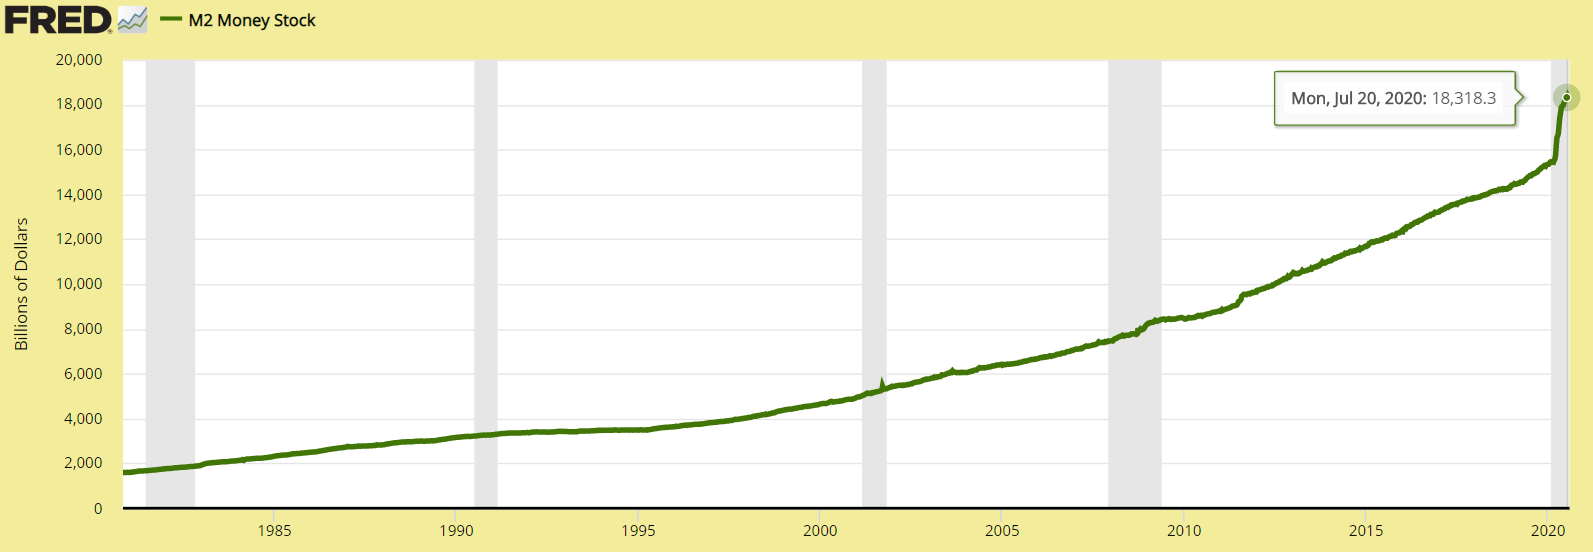
| Figure 1. Chart of M2 money supply showing how it has grown since 1980 and spiked in 2020 to $18.318 trillion. |
| Graphic provided by: https://fred.stlouisfed.org/. |
| |
| Since Covid-19 reared its head in the West in early 2020, the world has been forever changed. U.S. continued unemployment claims shot from 1.78 million on March 14 to a whopping 24.9 million by the first week of May and were still hovering around 14.8 million in early August. But while industries such as travel, hospitality and restaurants have been decimated, the stock market has been on a tear. By mid August, the S&P 500 was back to pre-covid highs while the tech sector was hitting new all-time highs led by stocks such as Tesla (up 430+%), Apple (up 110+%) and Amazon (up 100+% ) from their March lows. In fact, a search for U.S. stocks that has gained more than 100% between mid-March and August 20 produced a list of more than 530 stocks -- and this in a recession which was officially declared June 8. Observant Fed chart watchers witnessed the creation of new money on a scale never seen before with the near-instantaneous ramp up of money supply known as M1, M2 and M3. M1 is US dollars and coins in circulation plus travelers checks and demand account balances. As of August 3 it totaled $5.49 trillion. M2 is M1 plus a broader group of financial assets plus savings deposits, small denomination deposits(less than $100,000) and balances of retail money market mutual funds. M3 is M1 + M2 plus large deposits but was discontinued by the Federal Reserve for tracking purposes in 2016 but is still tracked by the OECD (totaling $18.17 trillion in June 2020). For the purposes of this discussion, we will focus on M2. On February 10 pre-pandemic, M2 stood at $15.37 trillion. By July 20 it had ballooned to $18.32 trillion, up $2.95 trillion. Where did that money come from? We need only ask Dr. Greenspan. |

|
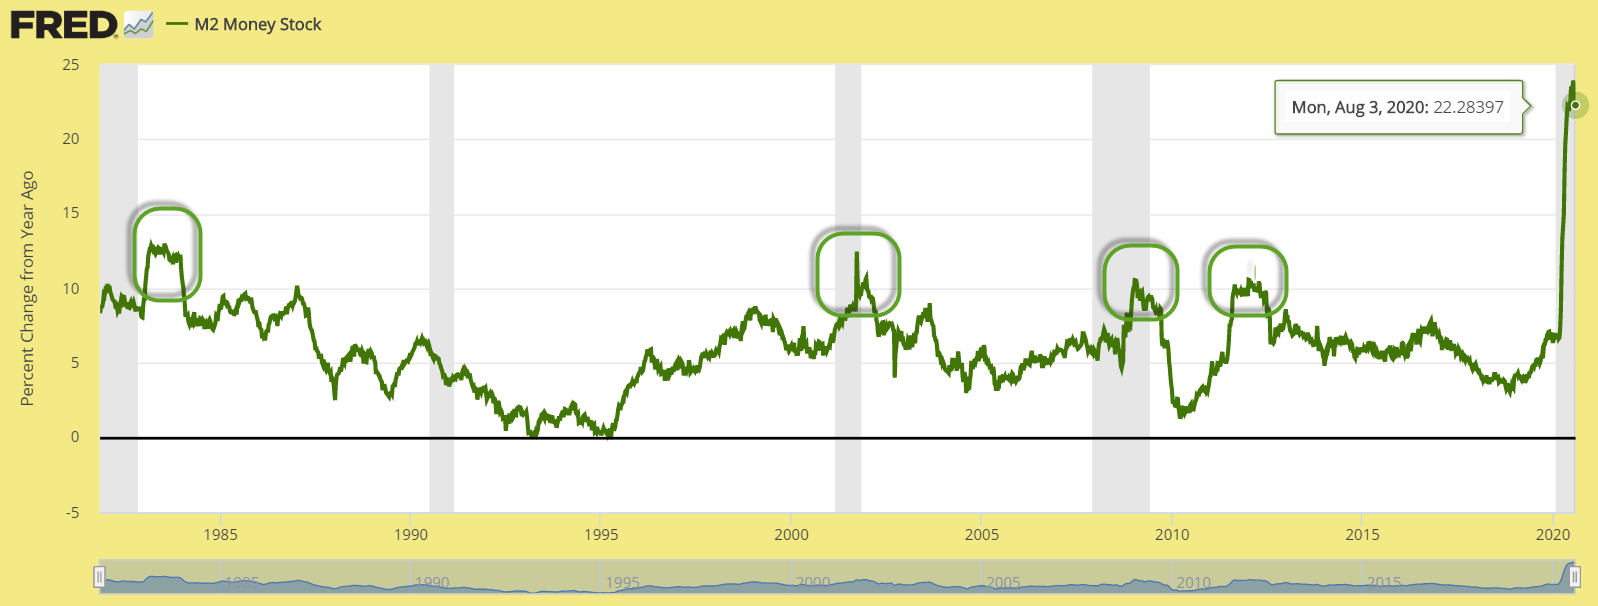
| Figure 2. M2 chart (not seasonally adjusted) showing the changes from the year before. There had been only four instances of increases greater than 10% (green ovals) until 2020 June when it spike more than 22% from the year before. |
| Graphic provided by: https://fred.stlouisfed.org/. |
| |
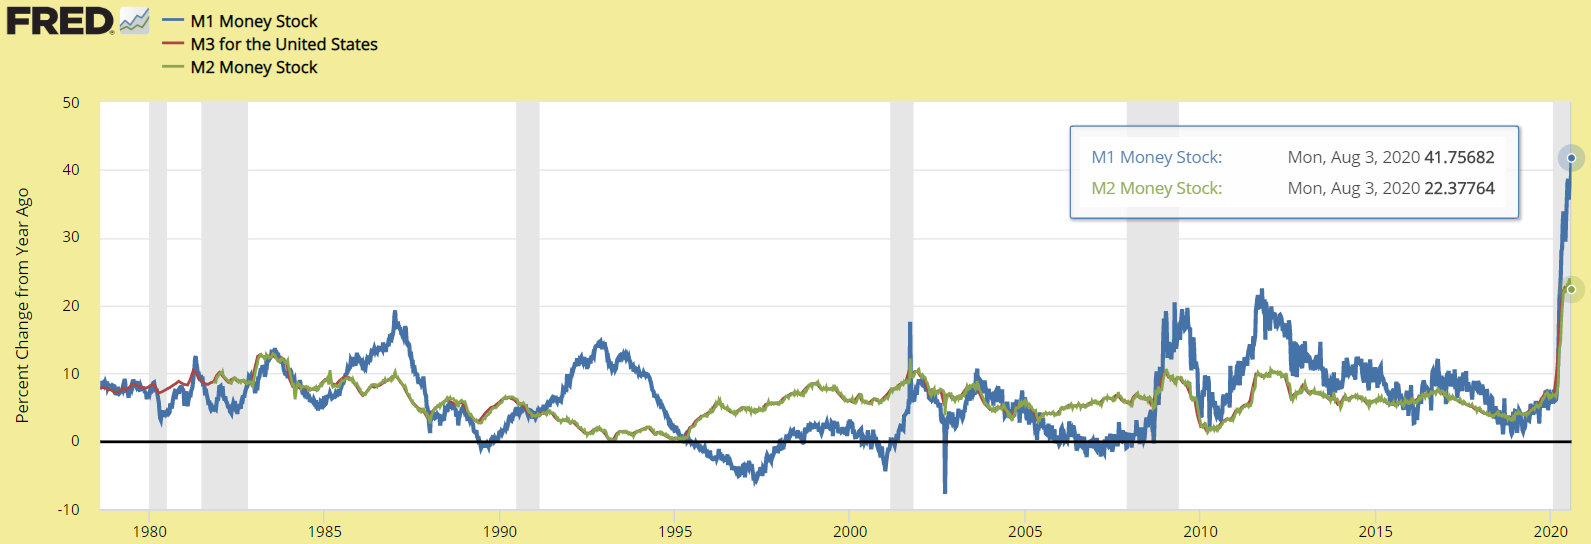
| More instructive is the chart showing the percentage change in M2 from the year before. As we see in the next chart (Figure 2), there have been less than a handful of times where money supply has increased more than 10% in the year and there had never been an increase greater than 15 percent. That changed in mid-2020 with a one-year increase of more than 22%! (see Figure 2) As we see in Figure 3, the percentage rise in money supply was similar across the board. |

|
| Figure 3. The percentage change from a year ago of M1, M2 and M3 since 2011 showing how all three spiked in 2020. M3 money stock data was discontinued by the Federal Reserve in 2006. M3 (red) shown here is provided by the OECD. |
| Graphic provided by: https://fred.stlouisfed.org/. |
| |
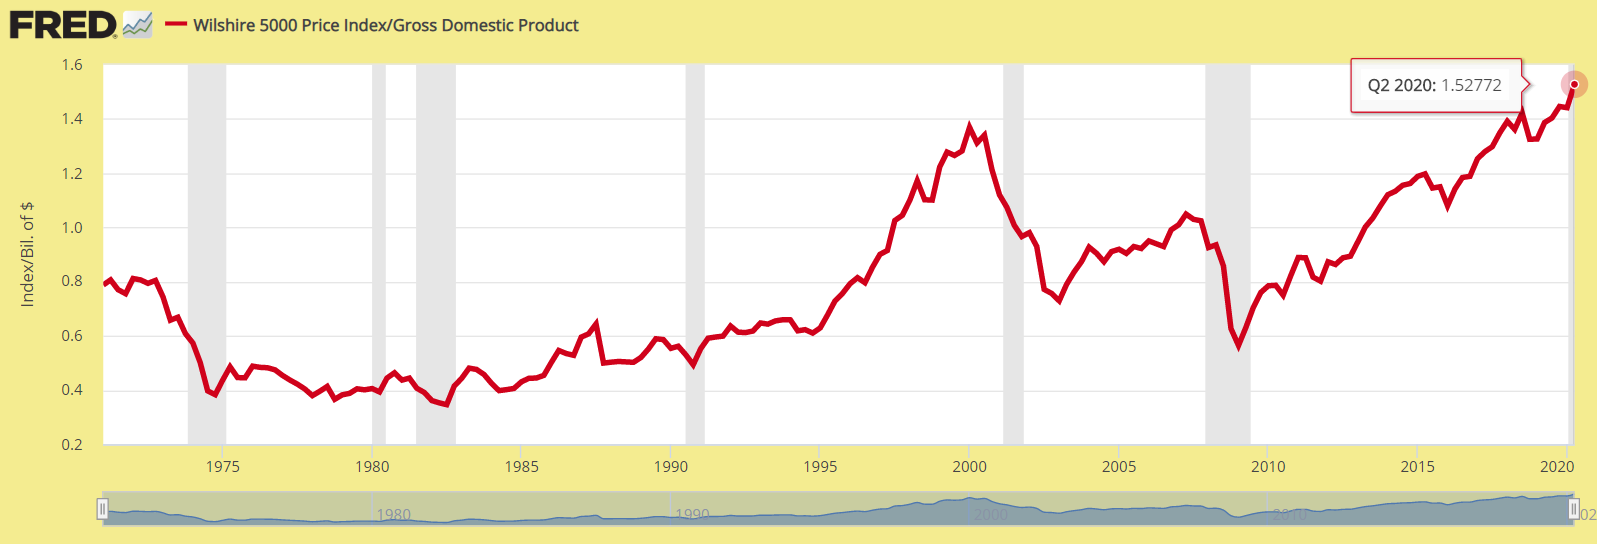
| It's difficult to say what would have happened had the Fed not stepped in as it did in March and April. Main Street was clearly suffering. But the flip side was that the huge capital infusion and falling interest rates created the perfect springboard for stocks with better than average business plans. As we see in the Figure 4, Warren Buffett's "single favorite stock market indicator" (Wilshire 5000 Index divided by US GDP) is getting even more overvalued and is well above where it stood at the height of the internet bubble of 2000. |

|
| Figure 4. Warren Buffett’s favorite single indicator of stock market valuations, the Wilshire 5000 divided by US Gross Domestic Product (GDP) which has been an excellent indicator of relative stock market valuations. |
| Graphic provided by: https://fred.stlouisfed.org/. |
| |
| As has always been the case, stocks will continue moving higher as long as investors expect to be able to sell them at higher prices. At the tail end of any rally, euphoria begins to defy gravity as irrational exuberance that ignores valuations and other fundamental metrics continues to find favor. Adding more money to the system at this point is like throwing gasoline on the fire. The question then becomes, what event or events will it take to bring expectations, and stock prices, back to earth again? Suggested Reading Greenspan: US "Can pay any debt it has..." Fun And Frustration With Fed Charts M2 - FRED St. Louis Federal Reserve What is the difference between m1, m2 and m3 money supply? US is 'printing' money to help save the economy from the COVID-19 crisis, but some wonder how far it can go Warren Buffett's favorite stock-market indicator 'scares the bejeezus' out of this investor |
Matt Blackman is a full-time technical and financial writer and trader. He produces corporate and financial newsletters, and assists clients in getting published in the mainstream media. Matt has earned the Chartered Market Technician (CMT) designation. Follow Matt on Twitter at www.twitter.com/RatioTrade
| Title: | Author |
| Company: | TradeSystemGuru |
| Address: | Box 2589 |
| Garibaldi Highlands, BC V0N1T0 | |
| Phone # for sales: | 6048989069 |
| E-mail address: | indextradermb@gmail.com |
Traders' Resource Links | |
| TradeSystemGuru has not added any product or service information to TRADERS' RESOURCE. | |
Click here for more information about our publications!
PRINT THIS ARTICLE

Request Information From Our Sponsors
- StockCharts.com, Inc.
- Candle Patterns
- Candlestick Charting Explained
- Intermarket Technical Analysis
- John Murphy on Chart Analysis
- John Murphy's Chart Pattern Recognition
- John Murphy's Market Message
- MurphyExplainsMarketAnalysis-Intermarket Analysis
- MurphyExplainsMarketAnalysis-Visual Analysis
- StockCharts.com
- Technical Analysis of the Financial Markets
- The Visual Investor
- VectorVest, Inc.
- Executive Premier Workshop
- One-Day Options Course
- OptionsPro
- Retirement Income Workshop
- Sure-Fire Trading Systems (VectorVest, Inc.)
- Trading as a Business Workshop
- VectorVest 7 EOD
- VectorVest 7 RealTime/IntraDay
- VectorVest AutoTester
- VectorVest Educational Services
- VectorVest OnLine
- VectorVest Options Analyzer
- VectorVest ProGraphics v6.0
- VectorVest ProTrader 7
- VectorVest RealTime Derby Tool
- VectorVest Simulator
- VectorVest Variator
- VectorVest Watchdog
