

HOT TOPICS LIST
- MACD
- Fibonacci
- RSI
- Gann
- ADXR
- Stochastics
- Volume
- Triangles
- Futures
- Cycles
- Volatility
- ZIGZAG
- MESA
- Retracement
- Aroon
INDICATORS LIST
LIST OF TOPICS
PRINT THIS ARTICLE
by Matt Blackman
Trying to determine what is going using publicly available data can be frustrating at the best of times. But data shortfalls become glaringly obvious when the picture is rapidly unraveling like it is now.
Position: N/A
Matt Blackman
Matt Blackman is a full-time technical and financial writer and trader. He produces corporate and financial newsletters, and assists clients in getting published in the mainstream media. Matt has earned the Chartered Market Technician (CMT) designation. Follow Matt on Twitter at www.twitter.com/RatioTrade
PRINT THIS ARTICLE
INVESTING
Fun And Frustration With Fed Charts
05/08/20 04:19:32 PMby Matt Blackman
Trying to determine what is going using publicly available data can be frustrating at the best of times. But data shortfalls become glaringly obvious when the picture is rapidly unraveling like it is now.
Position: N/A
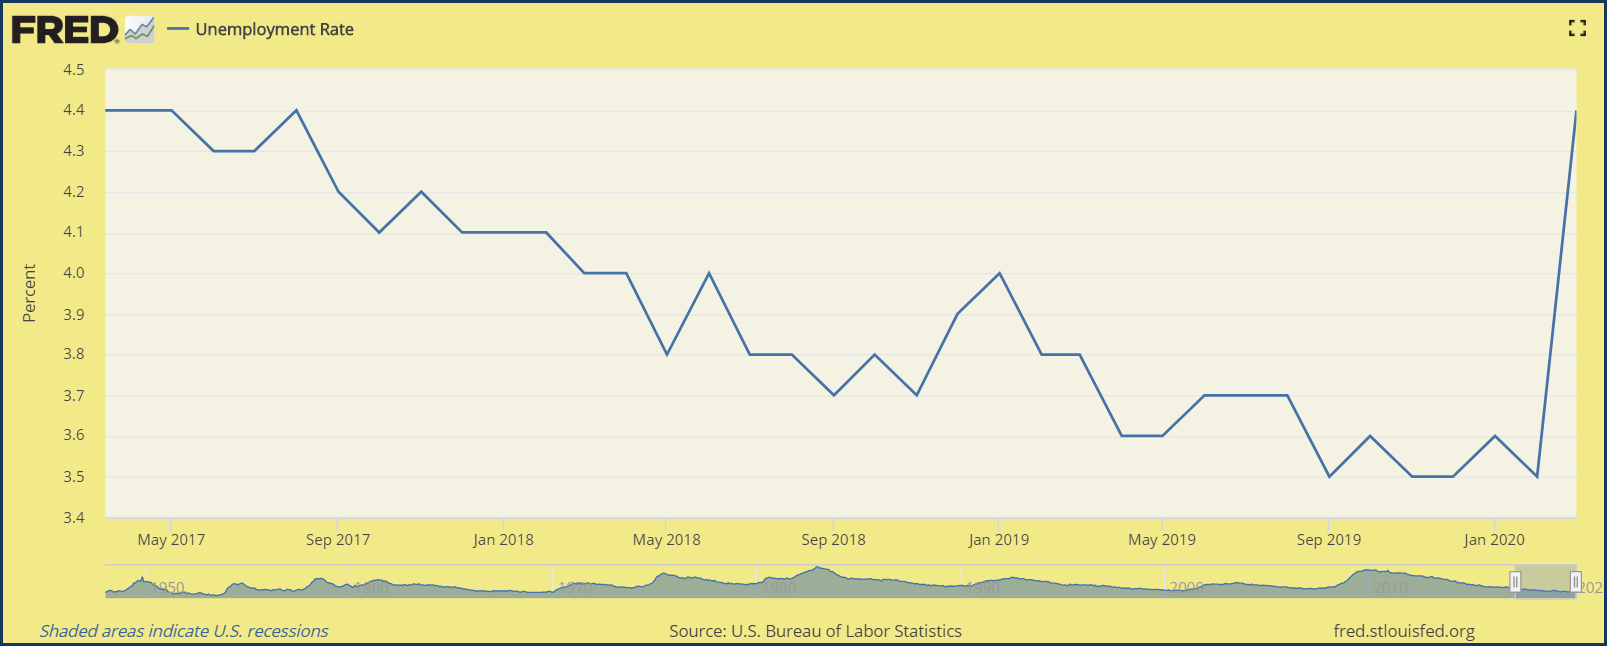
| Anyone who has relied on public data to research a topic quickly understands its limitations. On the Federal Reserve St Louis Reserve (FRED) website you can download, graph, and track 763,000 US and international time series from 94 sources. But what you soon realize is that data are updated daily in some cases, weekly, monthly, semi-annually or annually in others. And some data (Discontinued) has stopped updating altogether. Unemployment data is updated monthly so that the chart below has data updated April 3 to the end of March. And as we see from Figure 1, unemployment levels jumped to May and August 2017 levels of 4.4% up from 3.5% in February. But how realistic is that view now? |
|
| Figure 1. Monthly chart of unemployment data which goes back to 1948 at the Fed website. |
| Graphic provided by: https://fred.stlouisfed.org/. |
| |
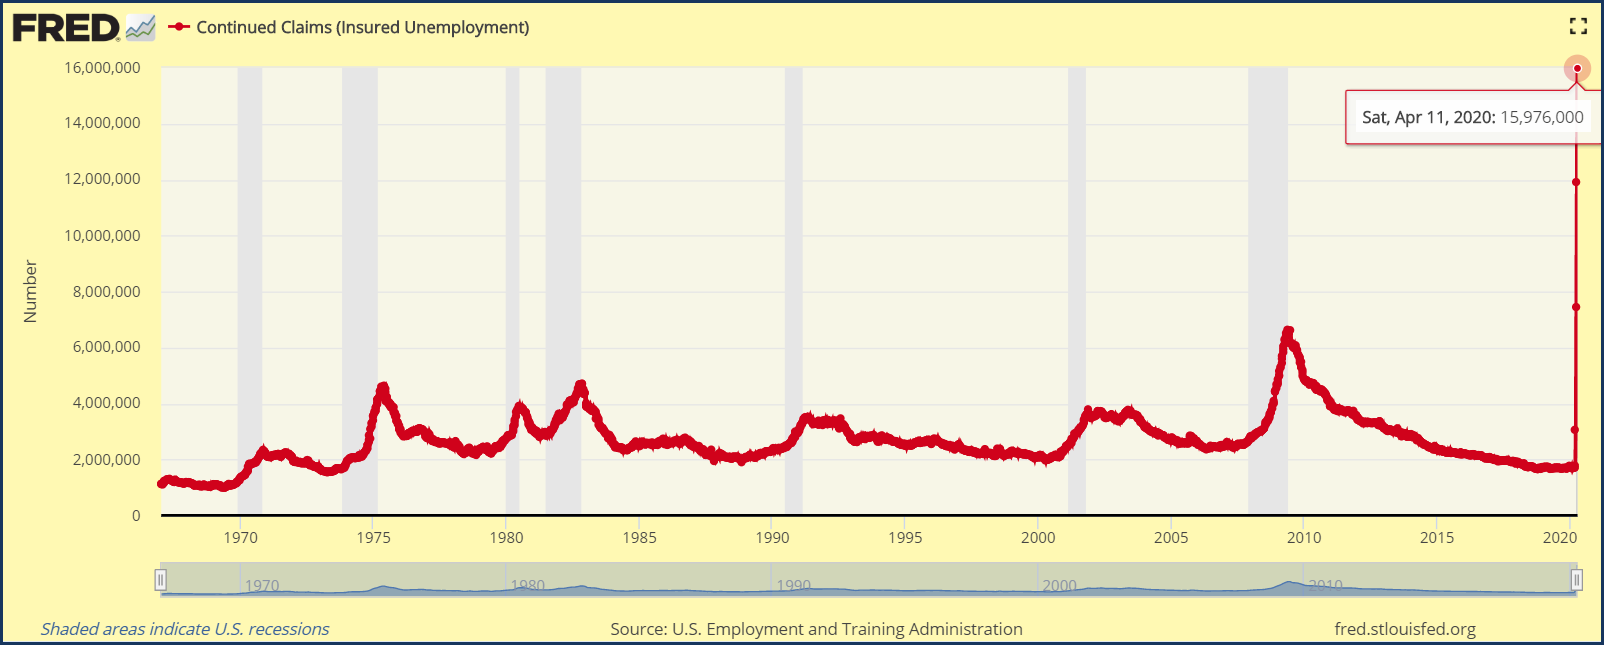
| For a more recent picture of unemployment, Continue Claims (Insured Unemployment) is updated weekly. The chart below included data up to April 11. And what a rapidly changing picture it provides! As we see, claims had jumped from 1.784 million March 14 to 15.976 million by April 11, which is an increase of nearly 800%. The prior week (April 4) there were 11.912 million claims which means we can expect more than 20 million claims for the week of April 19. |
|
| Figure 2. Continued claims (insured unemployment), a different perspective of unemployment, is updated weekly. |
| Graphic provided by: https://fred.stlouisfed.org/. |
| |
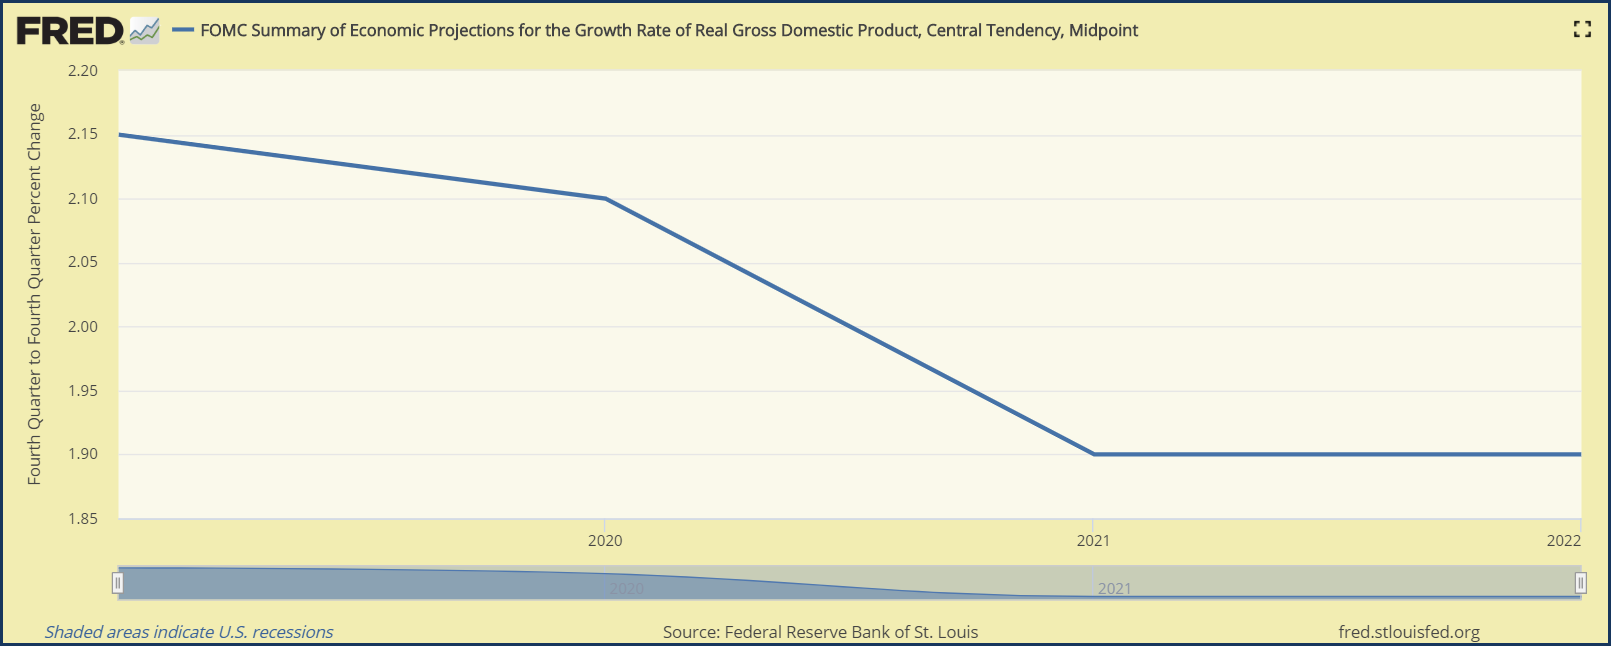
| If you wish to know what's happening with overall economy (Gross Domestic Product) for example, be prepared to wait awhile. Quarterly data is updated well after the fact. In the case of the chart below, the latest data available on April 24, 2020 was for Q4-2019 and showing the economy still growing. Data for Q1-2020 will be available on April 29 according to the Bureau of Economic Analysis (BEA) which supplies it. There are even some forecasts. FOMC Summary of Economic Projections for the Growth Rate of Real Gross Domestic Product, Central Tendency, Midpoint forecasts GDP growth up to three years ahead. The last forecast was issued December 11, 2019 (below). The economy was growing at 2.15% in 2019 and was forecast to drop to 1.9% by 2022. |
|
| Figure 3. The FOMC summary of economic projections for GDP through 2022. |
| Graphic provided by: https://fred.stlouisfed.org/. |
| |
| What actually happens will be interesting given that GDP was declining at 0.264% in Q1-2020 according to the Feds GDPNow data and economics at Goldman Sachs had recently cut estimates for -5% to -24% for Q2. It's at times like this that the folly of making forecasts years into the future becomes clearly evident. It also shows the weakness in relying too heavily on much of the fundamental data out there. As someone once said, it's like trying to drive your car down a winding road using your rear-view mirror! |
| Suggested Reading: Blackman, Matt [2020], May, "Is There a Recession in the Cards for 2020?" Blackman, Matt [2020], "Recession Watch 2020 - A Technical View Of Some Economic Data" |
Matt Blackman is a full-time technical and financial writer and trader. He produces corporate and financial newsletters, and assists clients in getting published in the mainstream media. Matt has earned the Chartered Market Technician (CMT) designation. Follow Matt on Twitter at www.twitter.com/RatioTrade
| Title: | Author |
| Company: | TradeSystemGuru |
| Address: | Box 2589 |
| Garibaldi Highlands, BC V0N1T0 | |
| Phone # for sales: | 6048989069 |
| E-mail address: | indextradermb@gmail.com |
Traders' Resource Links | |
| TradeSystemGuru has not added any product or service information to TRADERS' RESOURCE. | |
Click here for more information about our publications!
PRINT THIS ARTICLE

Request Information From Our Sponsors
- StockCharts.com, Inc.
- Candle Patterns
- Candlestick Charting Explained
- Intermarket Technical Analysis
- John Murphy on Chart Analysis
- John Murphy's Chart Pattern Recognition
- John Murphy's Market Message
- MurphyExplainsMarketAnalysis-Intermarket Analysis
- MurphyExplainsMarketAnalysis-Visual Analysis
- StockCharts.com
- Technical Analysis of the Financial Markets
- The Visual Investor
- VectorVest, Inc.
- Executive Premier Workshop
- One-Day Options Course
- OptionsPro
- Retirement Income Workshop
- Sure-Fire Trading Systems (VectorVest, Inc.)
- Trading as a Business Workshop
- VectorVest 7 EOD
- VectorVest 7 RealTime/IntraDay
- VectorVest AutoTester
- VectorVest Educational Services
- VectorVest OnLine
- VectorVest Options Analyzer
- VectorVest ProGraphics v6.0
- VectorVest ProTrader 7
- VectorVest RealTime Derby Tool
- VectorVest Simulator
- VectorVest Variator
- VectorVest Watchdog