

HOT TOPICS LIST
- MACD
- Fibonacci
- RSI
- Gann
- ADXR
- Stochastics
- Volume
- Triangles
- Futures
- Cycles
- Volatility
- ZIGZAG
- MESA
- Retracement
- Aroon
INDICATORS LIST
LIST OF TOPICS
PRINT THIS ARTICLE
by Matt Blackman
In my last article on economic indicators, I looked at the yield curve. In this article I update that chart as well as examine two more key metrics.
Position: N/A
Matt Blackman
Matt Blackman is a full-time technical and financial writer and trader. He produces corporate and financial newsletters, and assists clients in getting published in the mainstream media. Matt has earned the Chartered Market Technician (CMT) designation. Follow Matt on Twitter at www.twitter.com/RatioTrade
PRINT THIS ARTICLE
BULL/BEAR MARKET
Recession Watch 2020 - A Technical View Of Some Economic Data
01/30/20 04:37:59 PMby Matt Blackman
In my last article on economic indicators, I looked at the yield curve. In this article I update that chart as well as examine two more key metrics.
Position: N/A
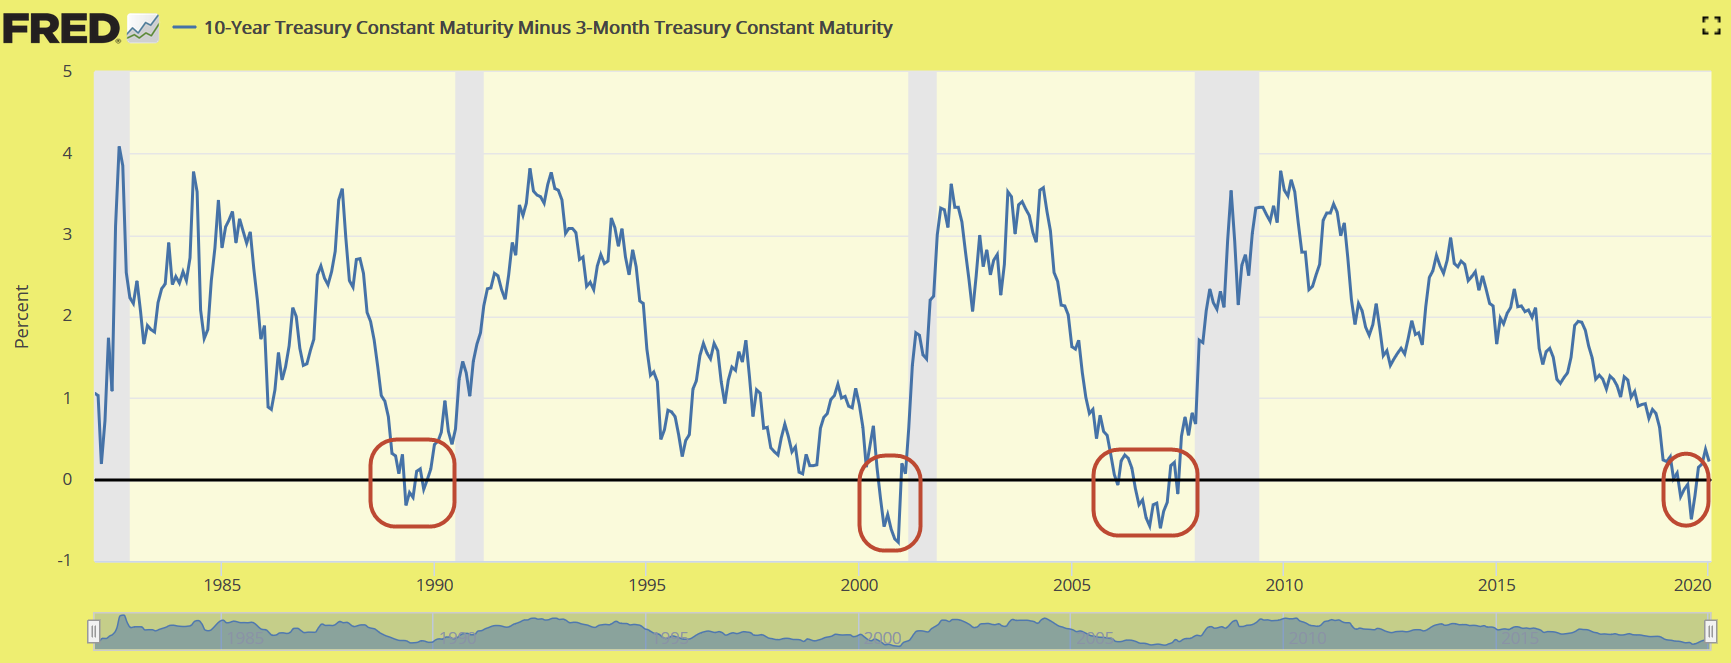
| There has been much ado about the slowing economy in the last few months. A few pundits tell us that a recession is coming while the majority opine it's not. But a growing number of indicators are flashing R-word concerns. As we saw in "Code REC - False Alarm Or Early Warning?" the yield curve has reverted which many have said means that the recession probability has lessened. But that does not prove up when looking at the long-term 10 year minus 3 month yield curve. We see in each case before a recession, the curve reverts months before a recession has officially been declared. |
|
| Figure 1. Yield curve depicted by 10-Year minus 3-month Treasury Yields showing inversions prior to each recession (vertical grey bars). |
| Graphic provided by: US Federal Reserve. |
| |
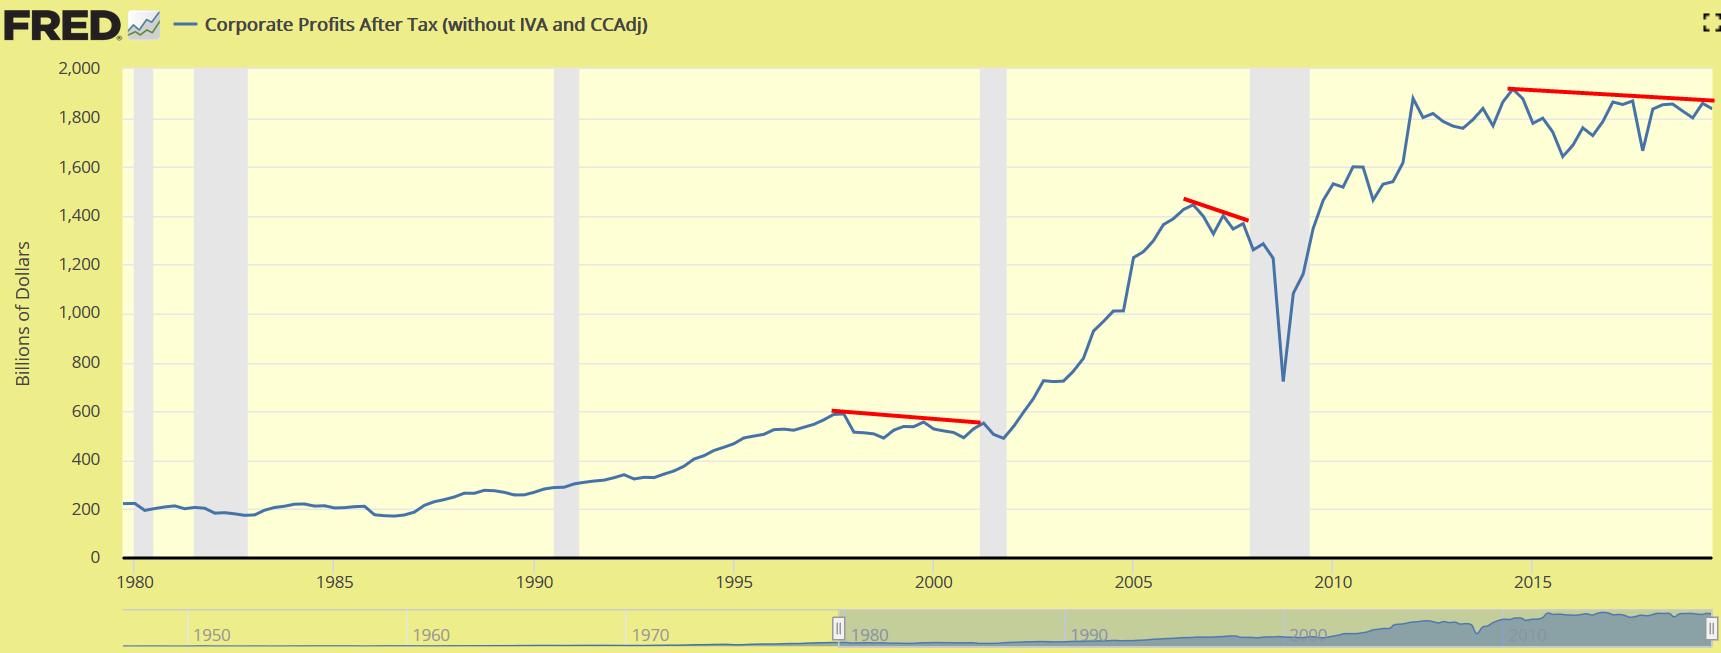
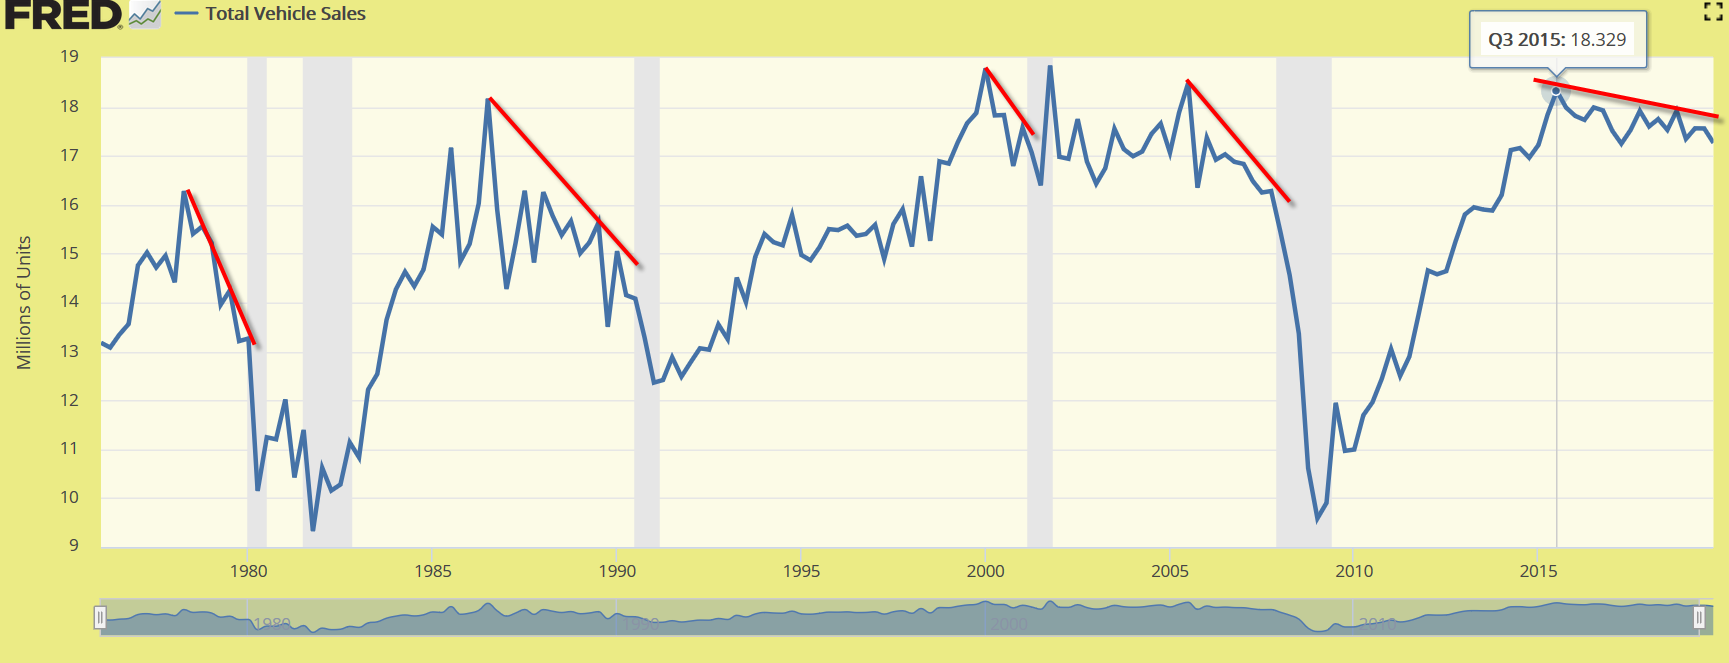
| But there is evidence of growing economic weakness in other key sectors. Stocks continue to rise when corporate profits are rising, but as we see in the next chart, that hasn't happened for a while now. Corporate profits began to plateau in 2012, peaked in 2014 and have been falling since then. And as the next chart clearly shows, corporate profits have suffered leading into each recession (vertical grey bars). Finally, another indicator of US economic health are automobile sales. As Figure 3 shows, auto sales peaked in late 2015 and have fallen to date. This has similarly occurred leading up to each recession as the falling red lines show. |
|
| Figure 2. Corporate profits after tax showing measurable flattening and declines in advance of each recession. Corporate profits began to flatten in 2012 then fell after peaking in 2014 (red line). |
| Graphic provided by: US Federal Reserve. |
| |
| There is a chance that corporate profits will reverse direction as will automotive sales, but there are no signs of these trend reversals so far at least. We are also in the fourth year of the Presidential Election Cycle which precedes two years of contraction. The $25 trillion question remains, will this slowdown wait until after the November election this time around, or will it come early as is suggested by the above charts? |
|
| Figure 3. Total US vehicle sales showing declines leading up to each recession since 1975. Latest figure peaked Q3-2015 and has fallen since then to date. |
| Graphic provided by: US Federal Reserve. |
| |
| Suggested Reading: Code REC - False Alarm Or Early Warning? Treasury Yield Curve Warning. Should We Pay Attention? |
Matt Blackman is a full-time technical and financial writer and trader. He produces corporate and financial newsletters, and assists clients in getting published in the mainstream media. Matt has earned the Chartered Market Technician (CMT) designation. Follow Matt on Twitter at www.twitter.com/RatioTrade
| Title: | Author |
| Company: | TradeSystemGuru |
| Address: | Box 2589 |
| Garibaldi Highlands, BC V0N1T0 | |
| Phone # for sales: | 6048989069 |
| E-mail address: | indextradermb@gmail.com |
Traders' Resource Links | |
| TradeSystemGuru has not added any product or service information to TRADERS' RESOURCE. | |
Click here for more information about our publications!
PRINT THIS ARTICLE

Request Information From Our Sponsors
- VectorVest, Inc.
- Executive Premier Workshop
- One-Day Options Course
- OptionsPro
- Retirement Income Workshop
- Sure-Fire Trading Systems (VectorVest, Inc.)
- Trading as a Business Workshop
- VectorVest 7 EOD
- VectorVest 7 RealTime/IntraDay
- VectorVest AutoTester
- VectorVest Educational Services
- VectorVest OnLine
- VectorVest Options Analyzer
- VectorVest ProGraphics v6.0
- VectorVest ProTrader 7
- VectorVest RealTime Derby Tool
- VectorVest Simulator
- VectorVest Variator
- VectorVest Watchdog
- StockCharts.com, Inc.
- Candle Patterns
- Candlestick Charting Explained
- Intermarket Technical Analysis
- John Murphy on Chart Analysis
- John Murphy's Chart Pattern Recognition
- John Murphy's Market Message
- MurphyExplainsMarketAnalysis-Intermarket Analysis
- MurphyExplainsMarketAnalysis-Visual Analysis
- StockCharts.com
- Technical Analysis of the Financial Markets
- The Visual Investor