

HOT TOPICS LIST
- MACD
- Fibonacci
- RSI
- Gann
- ADXR
- Stochastics
- Volume
- Triangles
- Futures
- Cycles
- Volatility
- ZIGZAG
- MESA
- Retracement
- Aroon
INDICATORS LIST
LIST OF TOPICS
PRINT THIS ARTICLE
by Matt Blackman
There have been a number of recession calls made of late. But does the recent reverting of the yield curve mean that our worries were overblown or could there be more clouds on the horizon?
Position: N/A
Matt Blackman
Matt Blackman is a full-time technical and financial writer and trader. He produces corporate and financial newsletters, and assists clients in getting published in the mainstream media. Matt has earned the Chartered Market Technician (CMT) designation. Follow Matt on Twitter at www.twitter.com/RatioTrade
PRINT THIS ARTICLE
BULL/BEAR MARKET
Code REC - False Alarm Or Early Warning?
11/21/19 04:27:37 PMby Matt Blackman
There have been a number of recession calls made of late. But does the recent reverting of the yield curve mean that our worries were overblown or could there be more clouds on the horizon?
Position: N/A
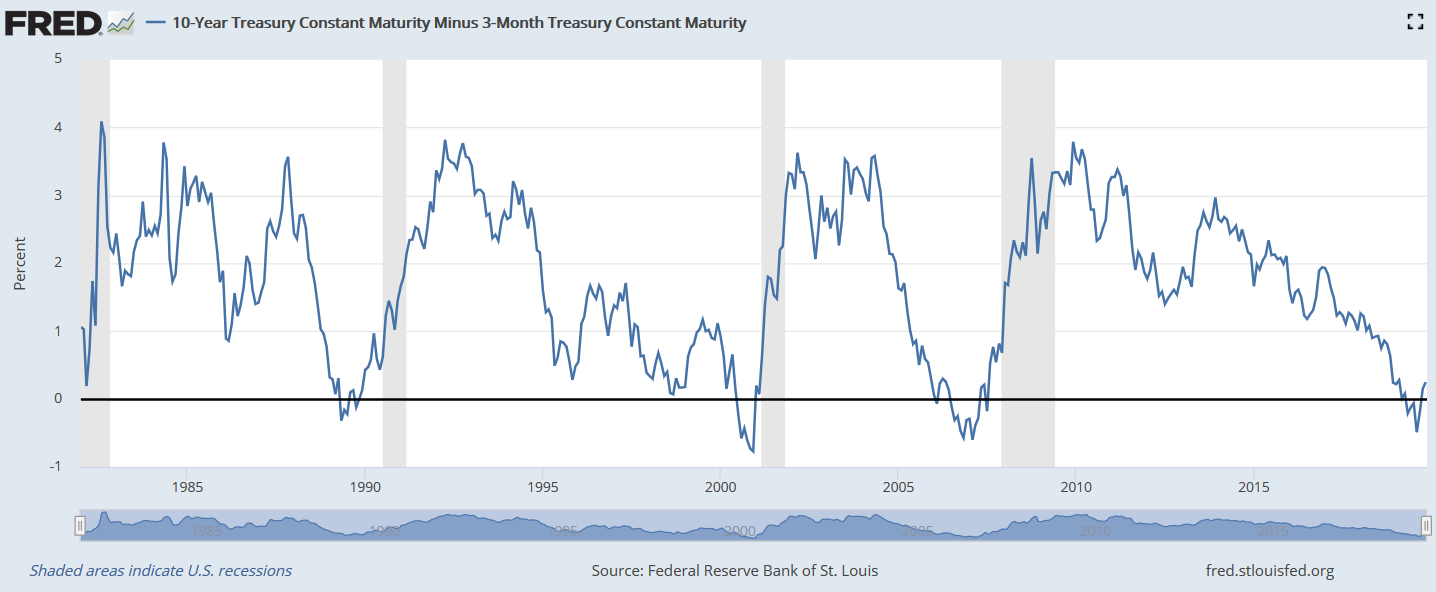
| In my article entitled "The Treasury Yield Curve Inverted Again - Should We Be Worried?" we looked at Professor Campbell Harvey's recession indicator, which up to 2009 has boasted a perfect accuracy rate in predicting recessions since 1962. In summary, his indicator fires a recession warning when the 10-Year US Treasury yield drops below the Treasury 3-month yield and stays negative for at least one quarter. |
|
| Figure 1. Long-term chart showing 10-Year US Treasury yields minus 3-month yields since 1982, which is as far back as the data goes. |
| Graphic provided by: https://fred.stlouisfed.org/. |
| |
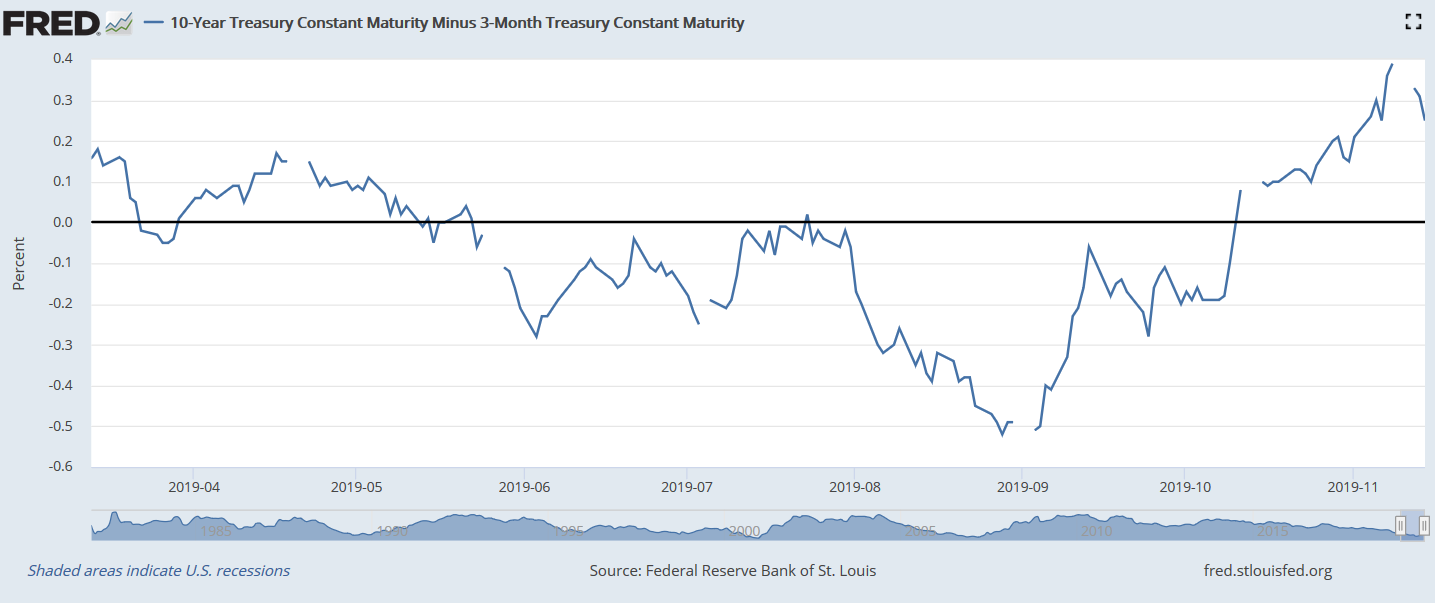
| In late Q2-2019 this indicator signal was again confirmed after first turning negative in March. It stayed negative until October 11 (Figure 2). |
|
| Figure 2. Chart showing the latest recession signal. The indicator turned positive again in early October. |
| Graphic provided by: https://fred.stlouisfed.org/. |
| |
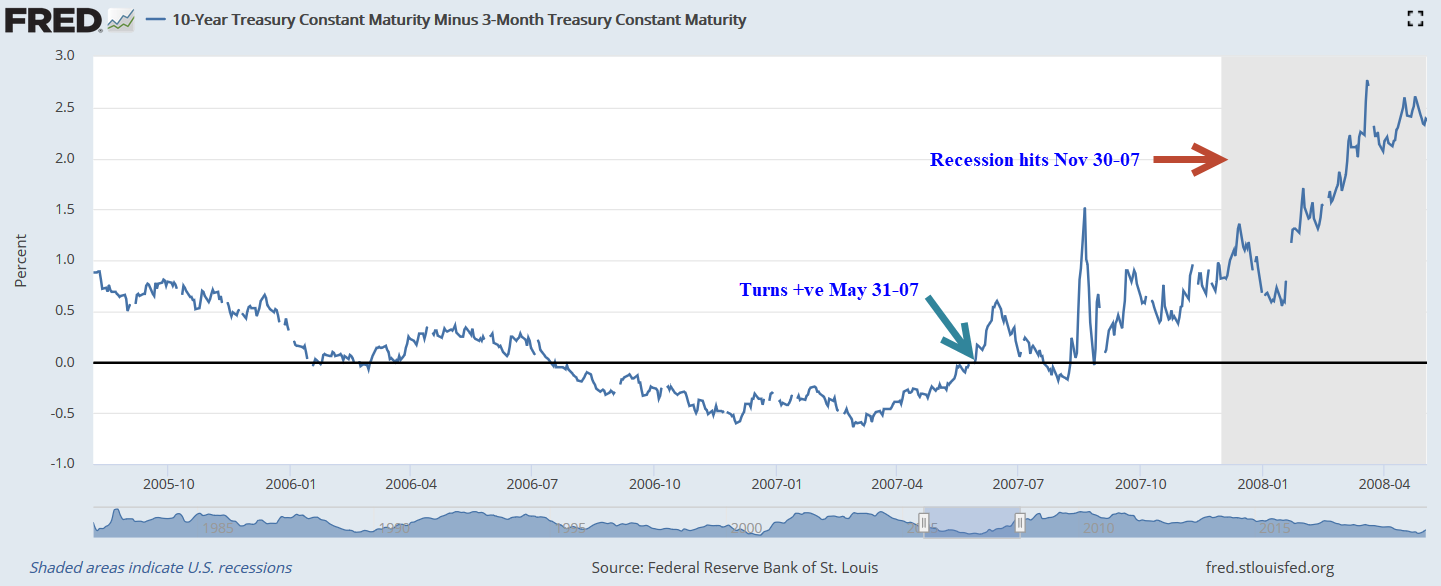
| As we see in Figure 3, the previous confirmed Harvey Indicator occurred in Q3-2006 before reverting back into positive territory again in May 2007. However, the great recession wasn't officially confirmed until the end of Q4-2007. |
|
| Figure 3. The last confirmed signal occurred in late 2006 and stayed negative until May 2007. The "great recession" wasn't officially confirmed until December 2007. |
| Graphic provided by: https://fred.stlouisfed.org/. |
| |
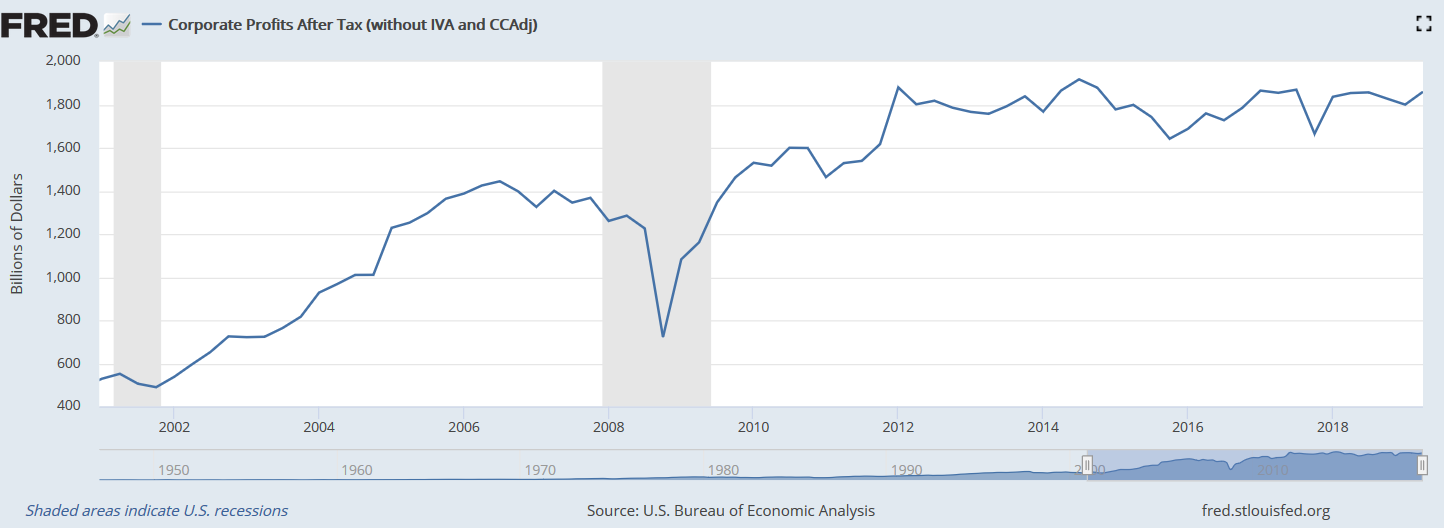
| A number of pundits, including Jim Cramer, have recently declared the recession risk either over or overblown, which is interesting considering that his preferred technique relies on fundamentals and corporate balance sheets, the latter of which have been flat since 2014 (see Figure 4). |
|
| Figure 4. Corporate after tax profits peaked in 2014 and have been more or less flat ever since. |
| Graphic provided by: https://fred.stlouisfed.org/. |
| |
| Given that it takes anywhere from six month to nearly two years for a recession to be declared by the National Bureau of Economic Research (NBER) after the first warning signs, it is still too early to sound the "all clear" signal! |
Matt Blackman is a full-time technical and financial writer and trader. He produces corporate and financial newsletters, and assists clients in getting published in the mainstream media. Matt has earned the Chartered Market Technician (CMT) designation. Follow Matt on Twitter at www.twitter.com/RatioTrade
| Title: | Author |
| Company: | TradeSystemGuru |
| Address: | Box 2589 |
| Garibaldi Highlands, BC V0N1T0 | |
| Phone # for sales: | 6048989069 |
| E-mail address: | indextradermb@gmail.com |
Traders' Resource Links | |
| TradeSystemGuru has not added any product or service information to TRADERS' RESOURCE. | |
Click here for more information about our publications!
PRINT THIS ARTICLE

Request Information From Our Sponsors
- StockCharts.com, Inc.
- Candle Patterns
- Candlestick Charting Explained
- Intermarket Technical Analysis
- John Murphy on Chart Analysis
- John Murphy's Chart Pattern Recognition
- John Murphy's Market Message
- MurphyExplainsMarketAnalysis-Intermarket Analysis
- MurphyExplainsMarketAnalysis-Visual Analysis
- StockCharts.com
- Technical Analysis of the Financial Markets
- The Visual Investor
- VectorVest, Inc.
- Executive Premier Workshop
- One-Day Options Course
- OptionsPro
- Retirement Income Workshop
- Sure-Fire Trading Systems (VectorVest, Inc.)
- Trading as a Business Workshop
- VectorVest 7 EOD
- VectorVest 7 RealTime/IntraDay
- VectorVest AutoTester
- VectorVest Educational Services
- VectorVest OnLine
- VectorVest Options Analyzer
- VectorVest ProGraphics v6.0
- VectorVest ProTrader 7
- VectorVest RealTime Derby Tool
- VectorVest Simulator
- VectorVest Variator
- VectorVest Watchdog