HOT TOPICS LIST
- MACD
- Fibonacci
- RSI
- Gann
- ADXR
- Stochastics
- Volume
- Triangles
- Futures
- Cycles
- Volatility
- ZIGZAG
- MESA
- Retracement
- Aroon
INDICATORS LIST
LIST OF TOPICS
PRINT THIS ARTICLE
by Matt Blackman
When the yield curve, defined by short-term rates dropping below long term, inverts, it generally indicates economic weakness. It has now been inverted for the most part since May.
Position: N/A
Matt Blackman
Matt Blackman is a full-time technical and financial writer and trader. He produces corporate and financial newsletters, and assists clients in getting published in the mainstream media. Matt has earned the Chartered Market Technician (CMT) designation. Follow Matt on Twitter at www.twitter.com/RatioTrade
PRINT THIS ARTICLE
BULL/BEAR MARKET
Treasury Yield Curve Warning. Should We Pay Attention?
08/22/19 04:55:19 PMby Matt Blackman
When the yield curve, defined by short-term rates dropping below long term, inverts, it generally indicates economic weakness. It has now been inverted for the most part since May.
Position: N/A
| Since analyzing the data for an article entitled "The Treasury Yield Curve Inverted Again - Should We Be Worried?", Federal Reserve data has continued to show an inverted yield curve. In this article we provide the most recent data. |

|
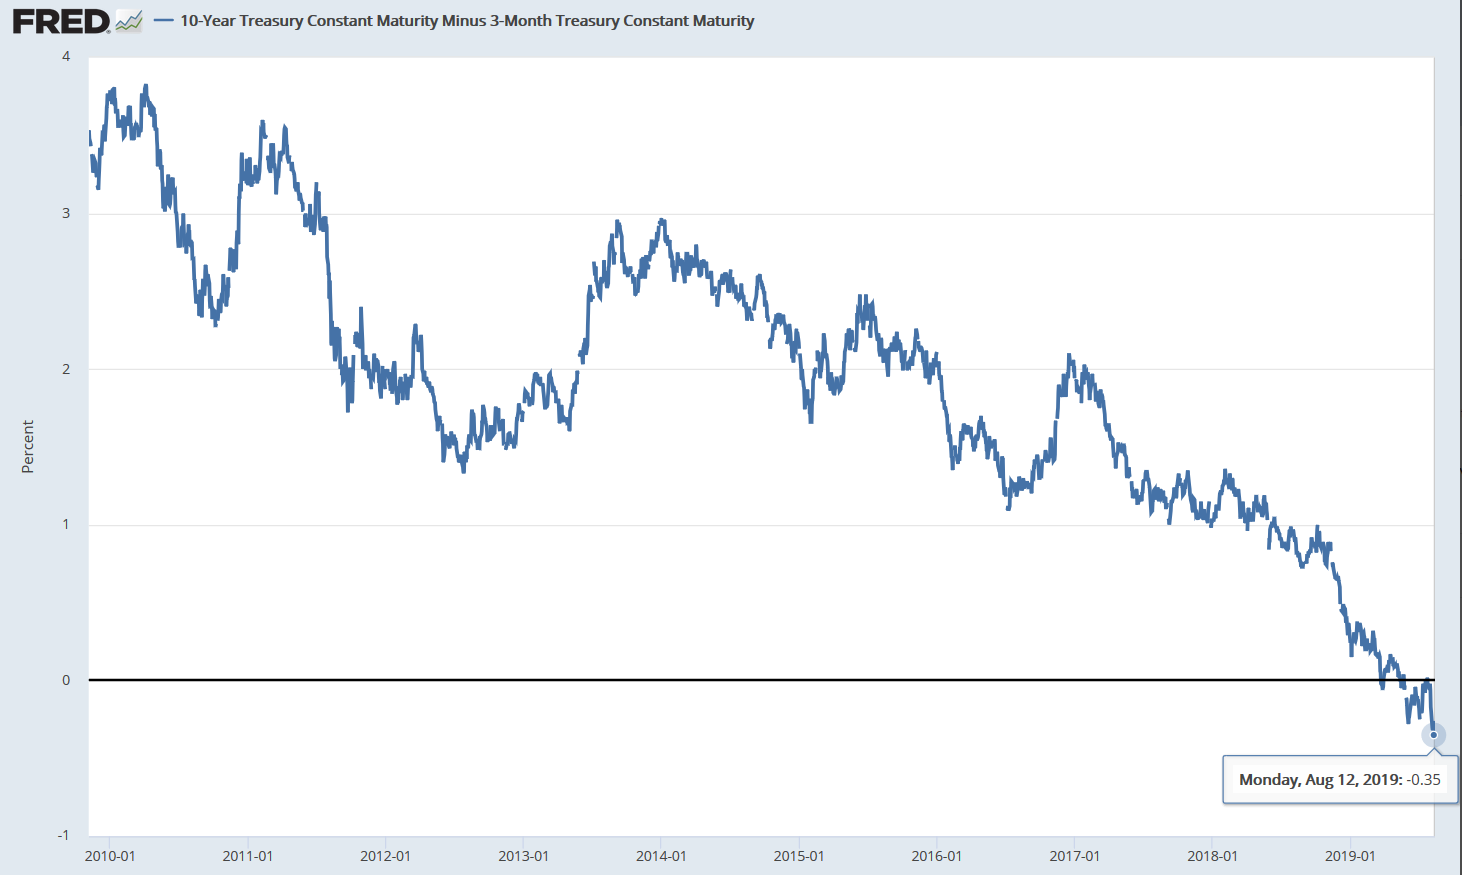
| Figure 1. Federal Reserve chart showing 10-Year Treasury Constant Maturity Yields minus 3-month Treasury Yields since 2010. |
| Graphic provided by: fred.stlouisfed.org. |
| |
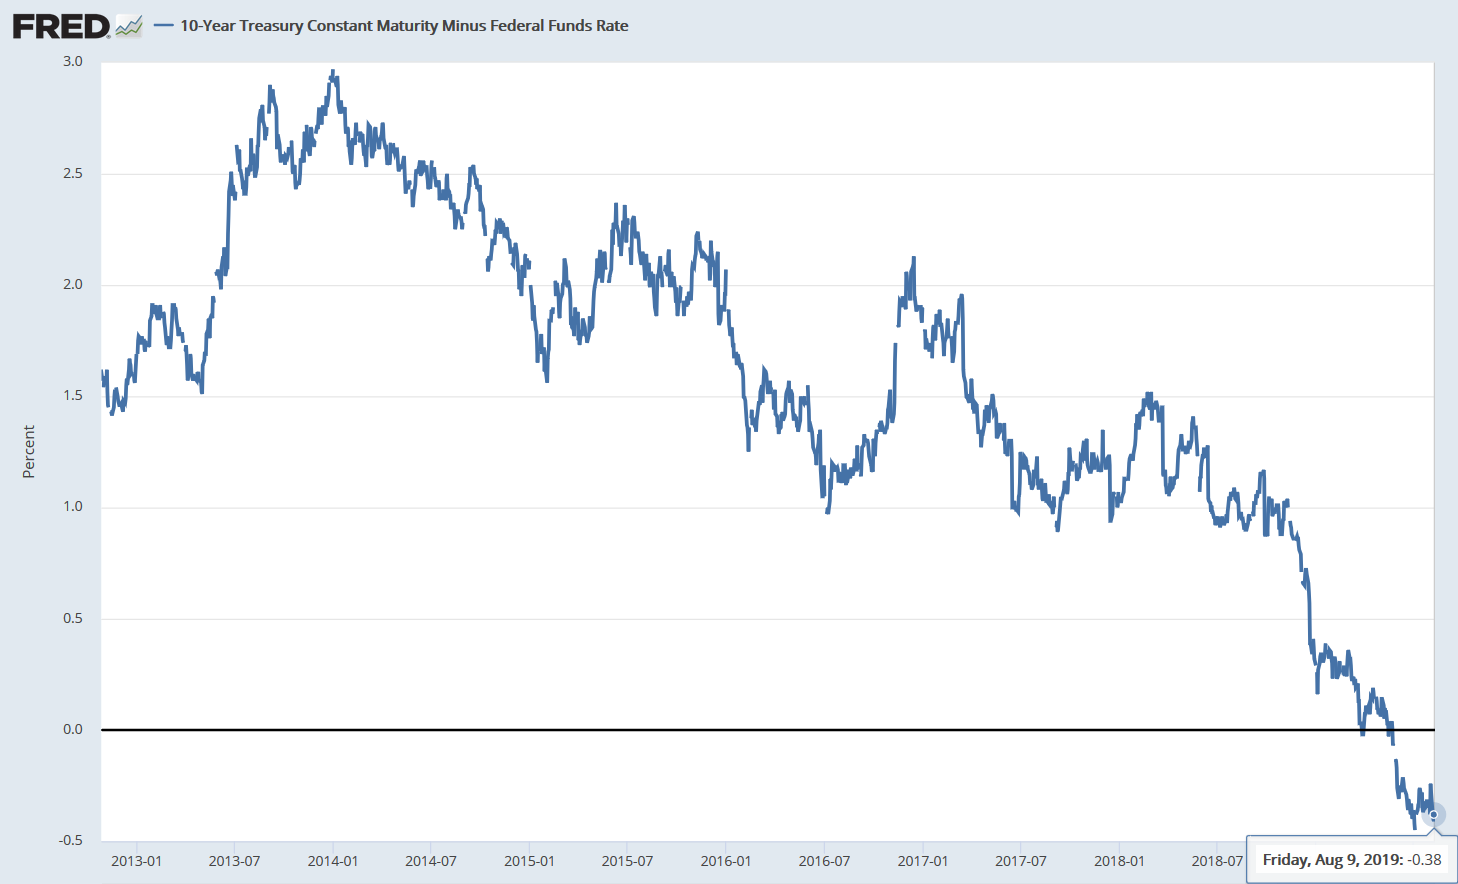
| Those tracking Treasury Yields would have witnessed that the daily 10-year Treasury yield (T10YR) first dropped below the 3-month Treasury yield (T3MO) rate on March 22, 2019 and stayed there for five days. Rates again dipped into negative territory and for all but six days in May, have remained negative (up to mid-August). As we see in the next chart, the Federal Reserve 10-year Yield minus Fed-Funds rate also first went negative in March then turned negative again in mid-May and has remained negative since (to mid-August). |

|
| Figure 2. Federal Reserve chart showing 10-Year Treasury Constant Maturity Yields minus Fed Funds rates since 2010. |
| Graphic provided by: fred.stlouisfed.org. |
| |
| A negative 10-year minus 3-month yield rate has proven surprisingly accurate in presaging U.S. recessions since 1960. The question is whether it will again prove prophetic. For those interested in a more detailed explanation, please refer to suggested reading below. |
| Suggested Reading: The Treasury Yield Curve Inverted Again - Should We Be Worried? Working Money |
Matt Blackman is a full-time technical and financial writer and trader. He produces corporate and financial newsletters, and assists clients in getting published in the mainstream media. Matt has earned the Chartered Market Technician (CMT) designation. Follow Matt on Twitter at www.twitter.com/RatioTrade
| Title: | Author |
| Company: | TradeSystemGuru |
| Address: | Box 2589 |
| Garibaldi Highlands, BC V0N1T0 | |
| Phone # for sales: | 6048989069 |
| E-mail address: | indextradermb@gmail.com |
Traders' Resource Links | |
| TradeSystemGuru has not added any product or service information to TRADERS' RESOURCE. | |
Click here for more information about our publications!
PRINT THIS ARTICLE

|

Request Information From Our Sponsors
- StockCharts.com, Inc.
- Candle Patterns
- Candlestick Charting Explained
- Intermarket Technical Analysis
- John Murphy on Chart Analysis
- John Murphy's Chart Pattern Recognition
- John Murphy's Market Message
- MurphyExplainsMarketAnalysis-Intermarket Analysis
- MurphyExplainsMarketAnalysis-Visual Analysis
- StockCharts.com
- Technical Analysis of the Financial Markets
- The Visual Investor
- VectorVest, Inc.
- Executive Premier Workshop
- One-Day Options Course
- OptionsPro
- Retirement Income Workshop
- Sure-Fire Trading Systems (VectorVest, Inc.)
- Trading as a Business Workshop
- VectorVest 7 EOD
- VectorVest 7 RealTime/IntraDay
- VectorVest AutoTester
- VectorVest Educational Services
- VectorVest OnLine
- VectorVest Options Analyzer
- VectorVest ProGraphics v6.0
- VectorVest ProTrader 7
- VectorVest RealTime Derby Tool
- VectorVest Simulator
- VectorVest Variator
- VectorVest Watchdog
