

HOT TOPICS LIST
- MACD
- Fibonacci
- RSI
- Gann
- ADXR
- Stochastics
- Volume
- Triangles
- Futures
- Cycles
- Volatility
- ZIGZAG
- MESA
- Retracement
- Aroon
INDICATORS LIST
LIST OF TOPICS
PRINT THIS ARTICLE
by Matt Blackman
The bigger question is what can we expect going forward?
Position: N/A
Matt Blackman
Matt Blackman is a full-time technical and financial writer and trader. He produces corporate and financial newsletters, and assists clients in getting published in the mainstream media. Matt has earned the Chartered Market Technician (CMT) designation. Follow Matt on Twitter at www.twitter.com/RatioTrade
PRINT THIS ARTICLE
BULL/BEAR MARKET
What Is Driving Stock Prices Into The Stratosphere?
01/29/21 05:36:33 PMby Matt Blackman
The bigger question is what can we expect going forward?
Position: N/A
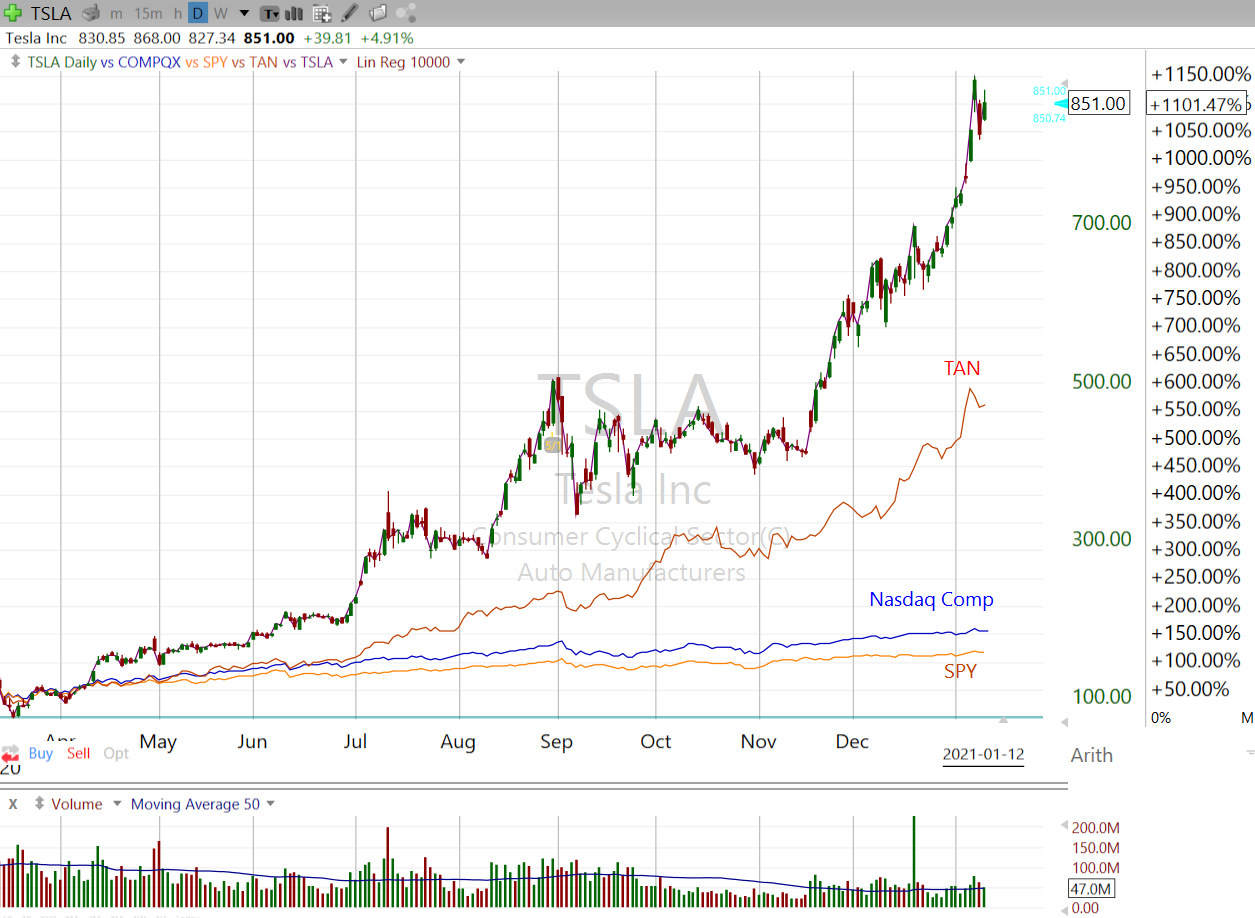
| There is little doubt that stocks had gotten frothy as year 2020 drew to a close. Many put in parabolic moves, up multiples from their March 2020 lows. The Standard & Poor's 500 Index had gained more than 70% and Nasdaq Composite Index was up more than 90% by mid-January. But these performances paled compared to some tech stocks, especially those of the clean and green variety. Chinese electric vehicle maker NIO was trading below $2.40 in late March. By mid-January 2021 it was north of $60 for a gain of more than 2800%. As we see from Figure 1, it was not alone. Car manufacturer Tesla gained more 1000% and the Solar ETF TAN gained more than 500%. These returns would be fantastic over a 10-year period. But that they occurred in under 10 months staggers the imagination not to mention the financial fortunes of those who bought them. |
|
| Figure 1. Daily chart of Tesla Inc. compared to the Solar ETF (TAN) in red, Nasdaq Composite (blue) and the S&P500 Trust ETF SPY (orange). |
| Graphic provided by: Freestockcharts.com. |
| |
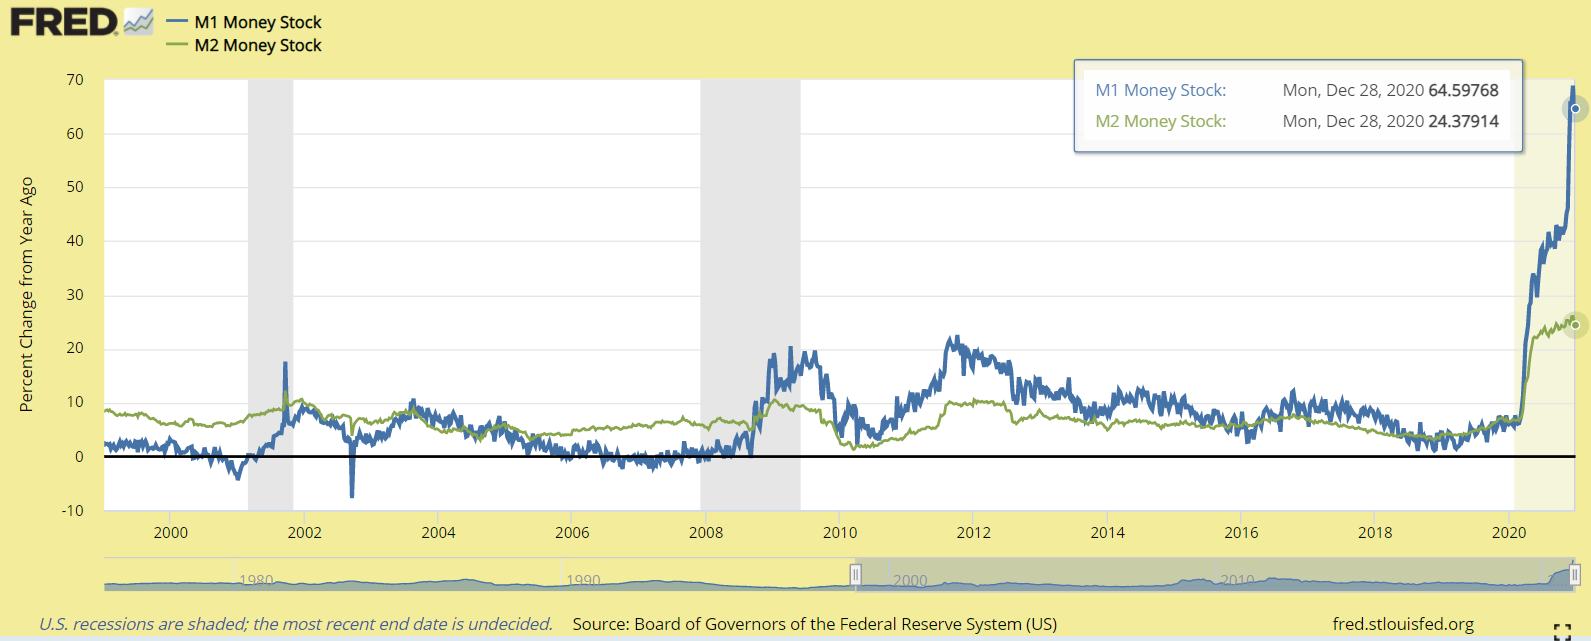
| So what has been driving these gains? One obvious culprit is the unprecedented trillions pumped into the monetary system by central banks in an effort to stem the flood of negative economic consequences from covid-19. As we see from Figure 2, Fed money supply metrics, namely M1 and M2, went on a tear. M1 is US dollars and coins in circulation plus travelers checks and demand account balances. M2 is M1 plus a broader group of financial assets plus savings deposits, small denomination deposits (less than $100,000) and balances of retail money market mutual funds. M3 is M1 + M2 plus large deposits. M3 was discontinued by the Federal Reserve for tracking purposes in 2016 but is still tracked by the OECD. On February 10, 2020, pre-pandemic, M2 stood at $15.37 trillion. By December 28 it had ballooned to $19.071 trillion, up $3.71 trillion. Year-over-year that's an increase of more than 24%. Money in circulation (M1) jumped more than 64% over the same period (see Figure 2). |
|
| Figure 2. Year-over-year percentage change in M1 and M2 money stock from the Federal Reserve. At time of writing, the latest data for M2 was October 2020 and December 2020 for M1. |
| Graphic provided by: https://fred.stlouisfed.org/. |
| |
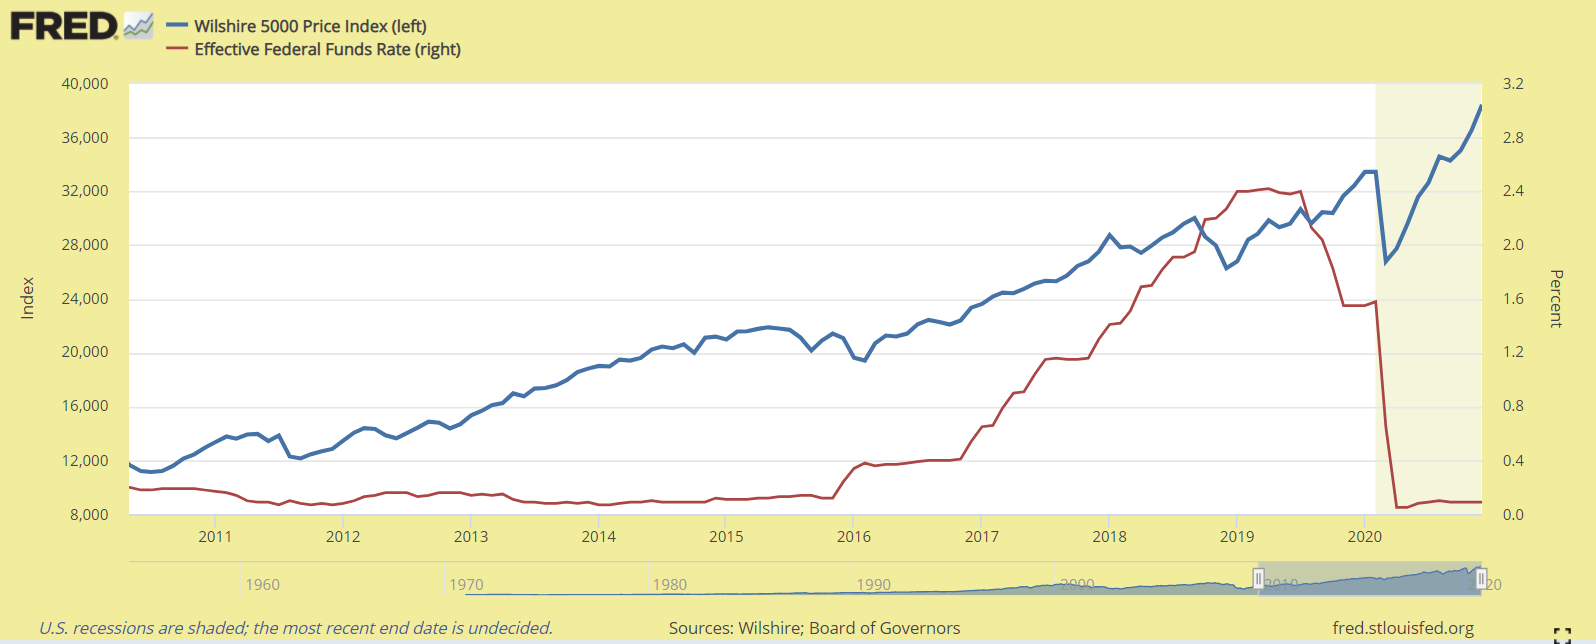
| The Fed was motivated to take such drastic action to stem the tide of layoffs and failing businesses, most of which are of the mom-and-pop variety. On March 14, 2020, there were less than 1.8 million continuous uninsured employment claims according to Fed data. That number soared to 24.9 million by early May and was still more than 5 million by the end of December so priming the money tree and writing stimulus checks has helped. However, stimulus money and continued low interest rates have had the unintended consequence of generating the perfect stock-buying storm with an added impetus of increased stimulus and rising expectations with the incoming U.S. Biden Administration for anything clean and green. |
|
| Figure 3.Wilshire 5000 and Fed Funds rate for the 2010 to year-end 2020. |
| Graphic provided by: https://fred.stlouisfed.org/. |
| |
| So what will put this trend to an end? Stay tuned! Suggested Reading: Cranking Up the Money Tree |
Matt Blackman is a full-time technical and financial writer and trader. He produces corporate and financial newsletters, and assists clients in getting published in the mainstream media. Matt has earned the Chartered Market Technician (CMT) designation. Follow Matt on Twitter at www.twitter.com/RatioTrade
| Title: | Author |
| Company: | TradeSystemGuru |
| Address: | Box 2589 |
| Garibaldi Highlands, BC V0N1T0 | |
| Phone # for sales: | 6048989069 |
| E-mail address: | indextradermb@gmail.com |
Traders' Resource Links | |
| TradeSystemGuru has not added any product or service information to TRADERS' RESOURCE. | |
Click here for more information about our publications!
PRINT THIS ARTICLE

Request Information From Our Sponsors
- VectorVest, Inc.
- Executive Premier Workshop
- One-Day Options Course
- OptionsPro
- Retirement Income Workshop
- Sure-Fire Trading Systems (VectorVest, Inc.)
- Trading as a Business Workshop
- VectorVest 7 EOD
- VectorVest 7 RealTime/IntraDay
- VectorVest AutoTester
- VectorVest Educational Services
- VectorVest OnLine
- VectorVest Options Analyzer
- VectorVest ProGraphics v6.0
- VectorVest ProTrader 7
- VectorVest RealTime Derby Tool
- VectorVest Simulator
- VectorVest Variator
- VectorVest Watchdog
- StockCharts.com, Inc.
- Candle Patterns
- Candlestick Charting Explained
- Intermarket Technical Analysis
- John Murphy on Chart Analysis
- John Murphy's Chart Pattern Recognition
- John Murphy's Market Message
- MurphyExplainsMarketAnalysis-Intermarket Analysis
- MurphyExplainsMarketAnalysis-Visual Analysis
- StockCharts.com
- Technical Analysis of the Financial Markets
- The Visual Investor