

HOT TOPICS LIST
- MACD
- Fibonacci
- RSI
- Gann
- ADXR
- Stochastics
- Volume
- Triangles
- Futures
- Cycles
- Volatility
- ZIGZAG
- MESA
- Retracement
- Aroon
INDICATORS LIST
LIST OF TOPICS
PRINT THIS ARTICLE
by Matt Blackman
How High Is Too High?
Position: N/A
Matt Blackman
Matt Blackman is a full-time technical and financial writer and trader. He produces corporate and financial newsletters, and assists clients in getting published in the mainstream media. Matt has earned the Chartered Market Technician (CMT) designation. Follow Matt on Twitter at www.twitter.com/RatioTrade
PRINT THIS ARTICLE
VALLEY & PEAK
Buffett's Indicator
06/24/21 02:22:15 PMby Matt Blackman
How High Is Too High?
Position: N/A
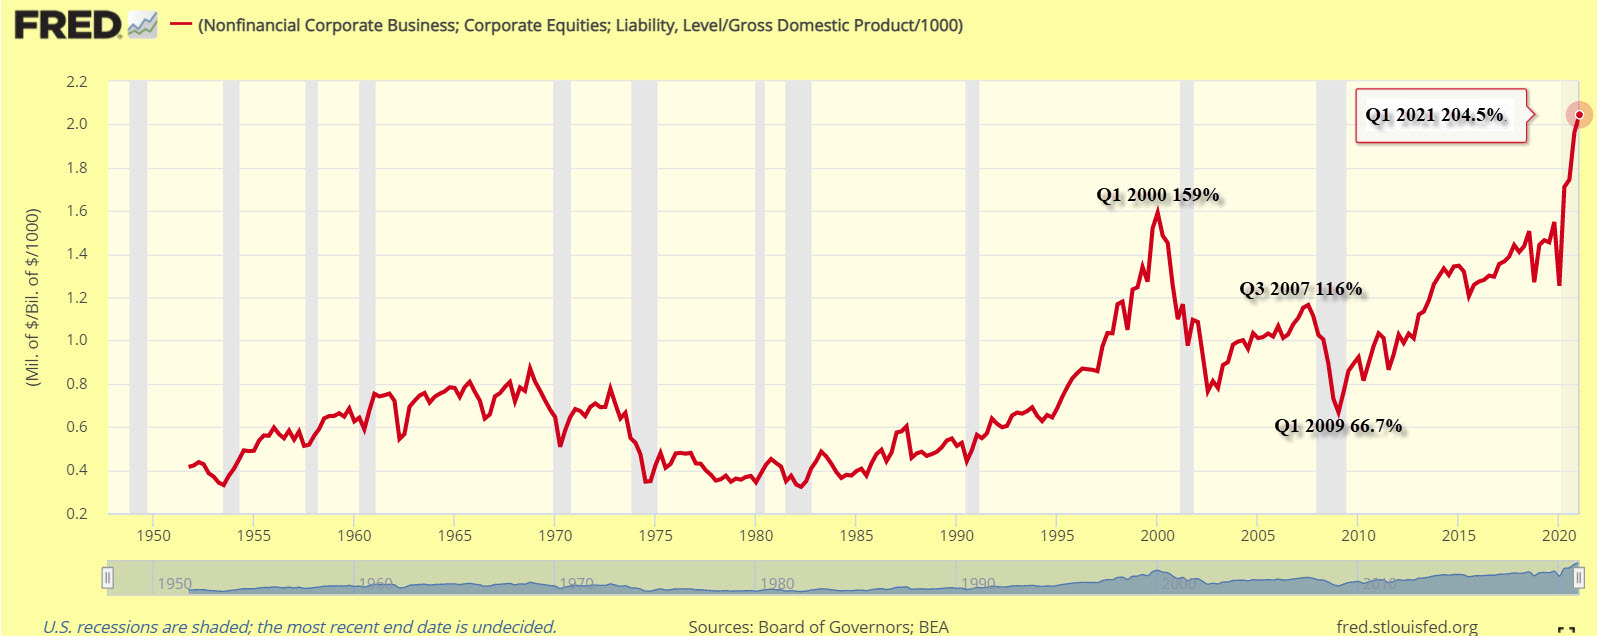
| It's not often that the Oracle of Omaha proffers his opinion on the stock market. So it's no surprise that when he does, investors and traders sit up and pay attention, especially when it concerns valuation. One of Warren Buffett's favorite indicators according to a 2001 Fortune Magazine article is total US market capitalization to U.S. GDP. Buffett opined in a November 1999 speech that it is "probably the best single measure of valuations stand at any given moment" according to an article in Fortune. At the time he believed that returns from stocks were about to fall dramatically. The Dow Jones Industrial Average at the time was trading at 11,194. By December 2001 it had dropped to 9900.. His indicator was total US stock market valuations (nonfinancial corporate business, corporate equities liability) to gross national product. In Figure 1 we substitute GNP for the more modern gross domestic product (GDP) measure. He used this metric to buy in 2009 when the indicator was below 70% according to "Buffett Metric Says Its Time to Buy." |
|
| Figure 1. Chart graphing corporate business equities and liabilities to GDP showing extremes in 2000, not so much in 2007, the low in 2009 and the latest data for Q1 2021 showing Buffett�s indicator in nosebleed territory. |
| Graphic provided by: https://fred.stlouisfed.org/. |
| |
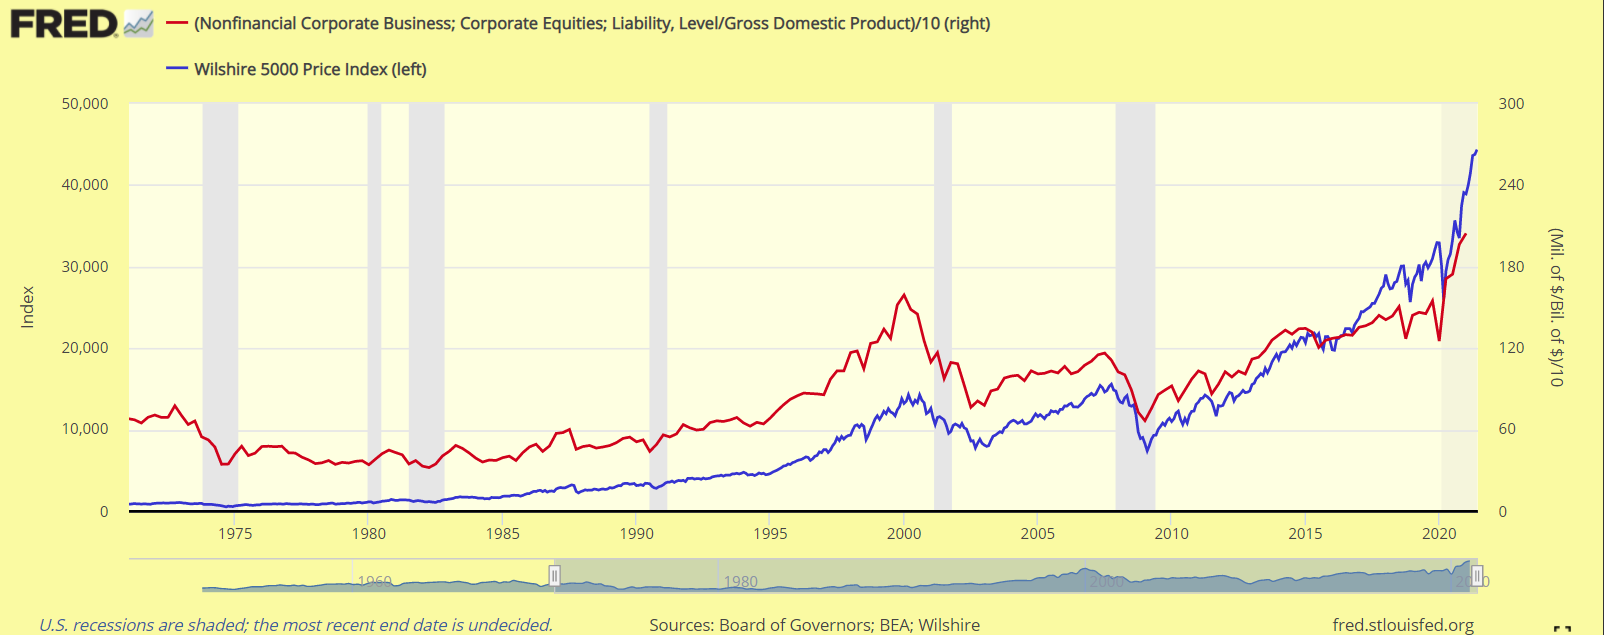
| But looking at the above chart, it is easier to see pivot points in retrospect. The barely overvalued peak in 2007 would have warned few unless they combined it with other indicators. Yes, the 2009 low was pretty clear. But since then it has continued to rise with barely a rest. It flew through the 2007 high in 2014 rested briefly then kept moving higher. Some erratic moves with rather large drops in 2018 and 2019 followed by a parabolic-like move from Q1 2020 as the printing presses were kicked into high gear. Looking at now gives the distinct impression that we are at a top. But one could have drawn the same conclusion at the Q3 2018 and Q4 2019 peaks. In our next chart comparing Buffett's Indicator with the Wilshire 5000, the latter looking even more overpriced after having risen nearly 500% from the low in February 2009! |
|
| Figure 2. Chart comparing Buffett�s Market Indicator with the Wilshire 5000 Index from 1970 to currently. |
| Graphic provided by: https://fred.stlouisfed.org/. |
| |
| It is tempting to conclude (again) that Buffett's Indicator has peaked. But based on past observation, that could be dangerous. Will it dip slightly or drop 30+%? Or will it flatten into a trading range for a while then resume it's uptrend? Ladies and gentlemen, place your trades! |
| Suggested Reading: Warren Buffett On The Stock Market Buffett Metric Says Its Time to Buy Cranking Up The Money Tree Bubblenomics - A Textbook Example? |
Matt Blackman is a full-time technical and financial writer and trader. He produces corporate and financial newsletters, and assists clients in getting published in the mainstream media. Matt has earned the Chartered Market Technician (CMT) designation. Follow Matt on Twitter at www.twitter.com/RatioTrade
| Title: | Author |
| Company: | TradeSystemGuru |
| Address: | Box 2589 |
| Garibaldi Highlands, BC V0N1T0 | |
| Phone # for sales: | 6048989069 |
| E-mail address: | indextradermb@gmail.com |
Traders' Resource Links | |
| TradeSystemGuru has not added any product or service information to TRADERS' RESOURCE. | |
Click here for more information about our publications!
Comments

Request Information From Our Sponsors
- StockCharts.com, Inc.
- Candle Patterns
- Candlestick Charting Explained
- Intermarket Technical Analysis
- John Murphy on Chart Analysis
- John Murphy's Chart Pattern Recognition
- John Murphy's Market Message
- MurphyExplainsMarketAnalysis-Intermarket Analysis
- MurphyExplainsMarketAnalysis-Visual Analysis
- StockCharts.com
- Technical Analysis of the Financial Markets
- The Visual Investor
- VectorVest, Inc.
- Executive Premier Workshop
- One-Day Options Course
- OptionsPro
- Retirement Income Workshop
- Sure-Fire Trading Systems (VectorVest, Inc.)
- Trading as a Business Workshop
- VectorVest 7 EOD
- VectorVest 7 RealTime/IntraDay
- VectorVest AutoTester
- VectorVest Educational Services
- VectorVest OnLine
- VectorVest Options Analyzer
- VectorVest ProGraphics v6.0
- VectorVest ProTrader 7
- VectorVest RealTime Derby Tool
- VectorVest Simulator
- VectorVest Variator
- VectorVest Watchdog