

HOT TOPICS LIST
- MACD
- Fibonacci
- RSI
- Gann
- ADXR
- Stochastics
- Volume
- Triangles
- Futures
- Cycles
- Volatility
- ZIGZAG
- MESA
- Retracement
- Aroon
INDICATORS LIST
LIST OF TOPICS
PRINT THIS ARTICLE
by Mark Rivest
Long-term Fibonacci price relationships could be major resistance for US stocks.
Position: N/A
Mark Rivest
Independent investment advisor, trader and writer. He has written articles for Technical Analysis of Stocks & Commodities, Traders.com Advantage,Futuresmag.com and, Finance Magnates. Author of website Four Dimension Trading.
PRINT THIS ARTICLE
MARKET TIMING
Entering The End Game - Part Two
01/29/21 05:48:23 PMby Mark Rivest
Long-term Fibonacci price relationships could be major resistance for US stocks.
Position: N/A
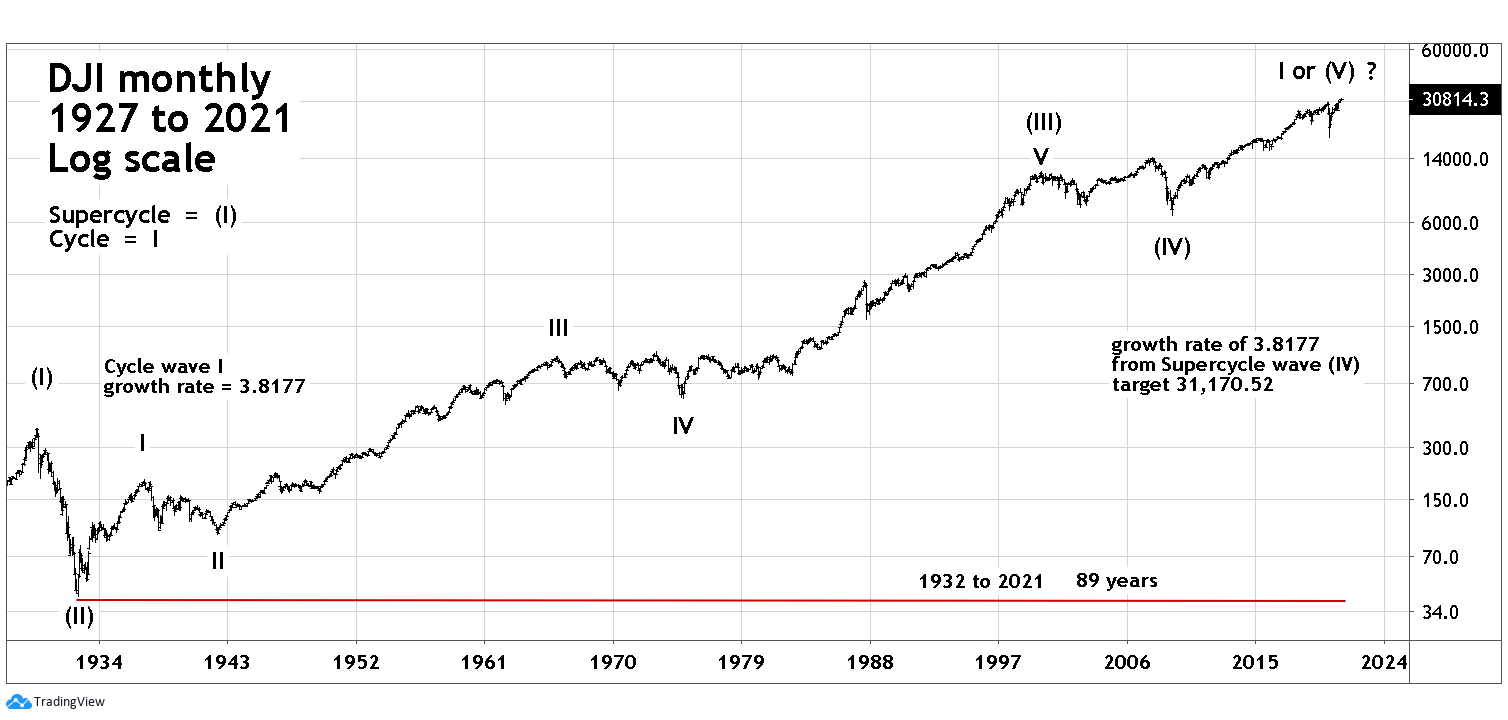
| The S&P 500 (SPX) rally from March 2020 to January 2021 has so far slightly exceeded the growth rate of the SPX March 2009 to January 2010 movement. This relationship was noted in my 12/30/20 article "Long-Term Elliott Wave Perspective For US Stocks". If this analogy continues the SPX rally could climax in late April/early May 2021. The Dow Jones Industrial Average (DJI) could have an even longer-term relationship which also points to a major peak. Dow Jones Industrial Average - Monthly The 12/30/20 article compared the growth rate of the March 2009 to April 2010 rally with the current rally since Mach 2020. The 2009 to 2010 bull run was the kickoff phase for the subsequent secular bull market, with the current run-up from March 2020 as a possible termination wave. The same concept can be used on a much larger time scale. Please see the monthly DJI chart illustrated in Figure 1. The DJI 1932 to 1937 bull market was the most powerful rally of the Twentieth century and was the kickoff phase for the subsequent decades long mega bull market. In just five years the DJI grew at a rate of 3.8177 times. Projecting this growth rate to the DJI bottom of 6470.00 made in March 2009 targets DJI 31170.52. The DJI all-time high so far as of January 14, 2021 is 31223.80 and has exceeded the target by 53.28 points, a difference of 53.28/31170.52 = .0017 — insignificant. When using Fibonacci ratio coordinates, allow for leeway. The DJI could continue higher and still be in the leeway zone. The monthly chart also illustrates the most likely long-term Elliott Wave count. Elliott wave guideline for relationships usually have wave one of a motive pattern equal to wave five. Could the secular bull market from the March 2009 bottom be the fifth wave of an 89-year mega bull market? It's possible, yet highly unlikely. Robert Prechter's book "Beautiful Pictures" examined the DJI movement from 1932 to 2000 in great detail, revealing dozens of Fibonacci price/time relationships throughout the entire structure. This study is perhaps the most extensive of any Elliott Wave pattern in history. Based on this overwhelming evidence the DJI rally from 1932 to 2000 is most likely a completed five-wave pattern. If a five-wave Elliott pattern completed in the year 2000 then what is the secular bull market from 2009 to 2021? One pattern could be a Cycle wave "I" of a developing Supercycle. After completion of Cycle wave "I" the subsequent decline could continue for several years. An alternate wave count has the rally from 2009 as Supercycle wave (V) implying the next bear market could be measured in decades. |
|
| Figure 1. The monthly chart illustrates the most likely long-term Elliott Wave count. |
| Graphic provided by: TradingView. |
| |
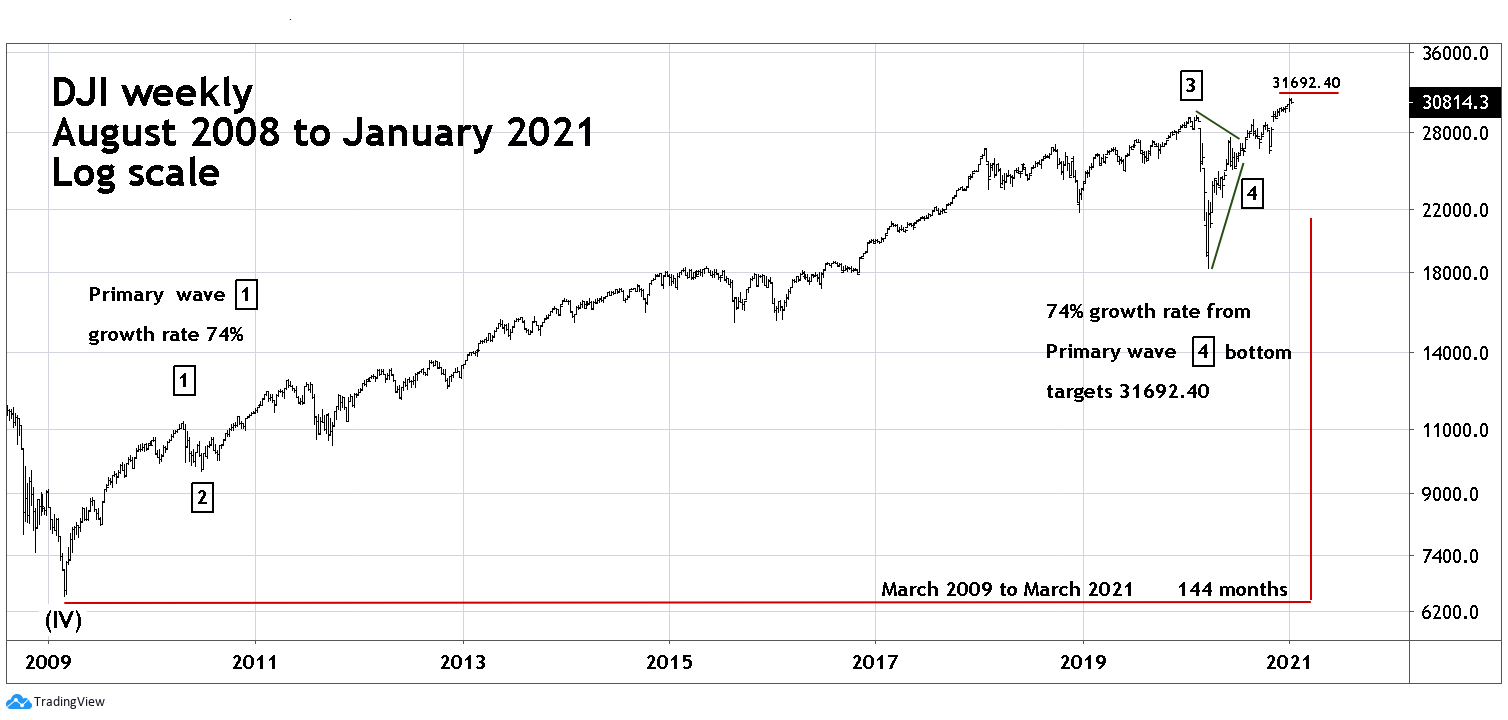
| Dow Jones Industrial Average - Weekly Please see the weekly DJI chart illustrated in Figure 2. Narrowing the focus to the secular bull market from March 2009 we see that the DJI kickoff rally 2009 to 2010 had a growth rate of 74%. Projecting this rate to the DJI March 2020 bottom targets 31692.40, which is 468.60 points above the current all-time high, a difference of 468.60/31223.80 = .015. If the DJI can rally near this number, it will also be within leeway of the multi-decade Fibonacci coordinate derived from the 1932 to 1937 bull market. These two long-term Fibonacci points represent potentially powerful resistance. |
|
| Figure 2. The DJI kickoff rally 2009 to 2010 had a growth rate of 74%. |
| Graphic provided by: TradingView. |
| |
| Fibonacci Time Cycles My 01/14/21 article "Entering The End Game" noted that Mach 2021 is a Fibonacci 144 months since the start of the secular bull market in March 2009. When using Fibonacci sequence numbers there is no leeway, it's either a Fibonacci number or it's not. The 1932 to 1937 bull market lasted 56 months which is not a Fibonacci number. However, there could be a Fibonacci ratio relationship between the bull move of the 1930's and the rally since 2009. For example, suppose the DJI makes a final high in March 2021. The ratio of the two bull markets is 56/144 = .388. A top in April 2021 is a ratio of 56/145 = .386. A peak in May 2021 is a ratio of 56/146 = .383 — almost a direct hit of the Fibonacci ratio of .382. |
| Fibonacci Price/Time Combination If the DJI can continue to climb into April/May 2021 and is in the area of 31600 to 31700 it could be in the zone of potentially powerful price resistance at a time defined by coordinates that go back decades. How important could this top be? Look at the peaks made in 1929, 1966, 1973, 2000, and 2007. Since 2009 the bulls have been dominant in the US stock market. That dominance could soon be challenged. Further Reading: Prechter Jr. R. Robert (2003) "Beautiful Pictures", New Classics Library. Frost A.J and Robert Prechter (1985) "Elliott Wave Principle", New Classics Library. |
Independent investment advisor, trader and writer. He has written articles for Technical Analysis of Stocks & Commodities, Traders.com Advantage,Futuresmag.com and, Finance Magnates. Author of website Four Dimension Trading.
| Website: | www.fourdimensiontrading.com |
| E-mail address: | markrivest@gmail.com |
Click here for more information about our publications!
PRINT THIS ARTICLE

Request Information From Our Sponsors
- VectorVest, Inc.
- Executive Premier Workshop
- One-Day Options Course
- OptionsPro
- Retirement Income Workshop
- Sure-Fire Trading Systems (VectorVest, Inc.)
- Trading as a Business Workshop
- VectorVest 7 EOD
- VectorVest 7 RealTime/IntraDay
- VectorVest AutoTester
- VectorVest Educational Services
- VectorVest OnLine
- VectorVest Options Analyzer
- VectorVest ProGraphics v6.0
- VectorVest ProTrader 7
- VectorVest RealTime Derby Tool
- VectorVest Simulator
- VectorVest Variator
- VectorVest Watchdog
- StockCharts.com, Inc.
- Candle Patterns
- Candlestick Charting Explained
- Intermarket Technical Analysis
- John Murphy on Chart Analysis
- John Murphy's Chart Pattern Recognition
- John Murphy's Market Message
- MurphyExplainsMarketAnalysis-Intermarket Analysis
- MurphyExplainsMarketAnalysis-Visual Analysis
- StockCharts.com
- Technical Analysis of the Financial Markets
- The Visual Investor