

HOT TOPICS LIST
- MACD
- Fibonacci
- RSI
- Gann
- ADXR
- Stochastics
- Volume
- Triangles
- Futures
- Cycles
- Volatility
- ZIGZAG
- MESA
- Retracement
- Aroon
INDICATORS LIST
LIST OF TOPICS
PRINT THIS ARTICLE
by Mark Rivest
Qualcomm's history could be a forecast for Zoom Video Communications.
Position: N/A
Mark Rivest
Independent investment advisor, trader and writer. He has written articles for Technical Analysis of Stocks & Commodities, Traders.com Advantage,Futuresmag.com and, Finance Magnates. Author of website Four Dimension Trading.
PRINT THIS ARTICLE
MOMENTUM
Qualcomm And Zoom Connection
11/25/20 05:31:19 PMby Mark Rivest
Qualcomm's history could be a forecast for Zoom Video Communications.
Position: N/A
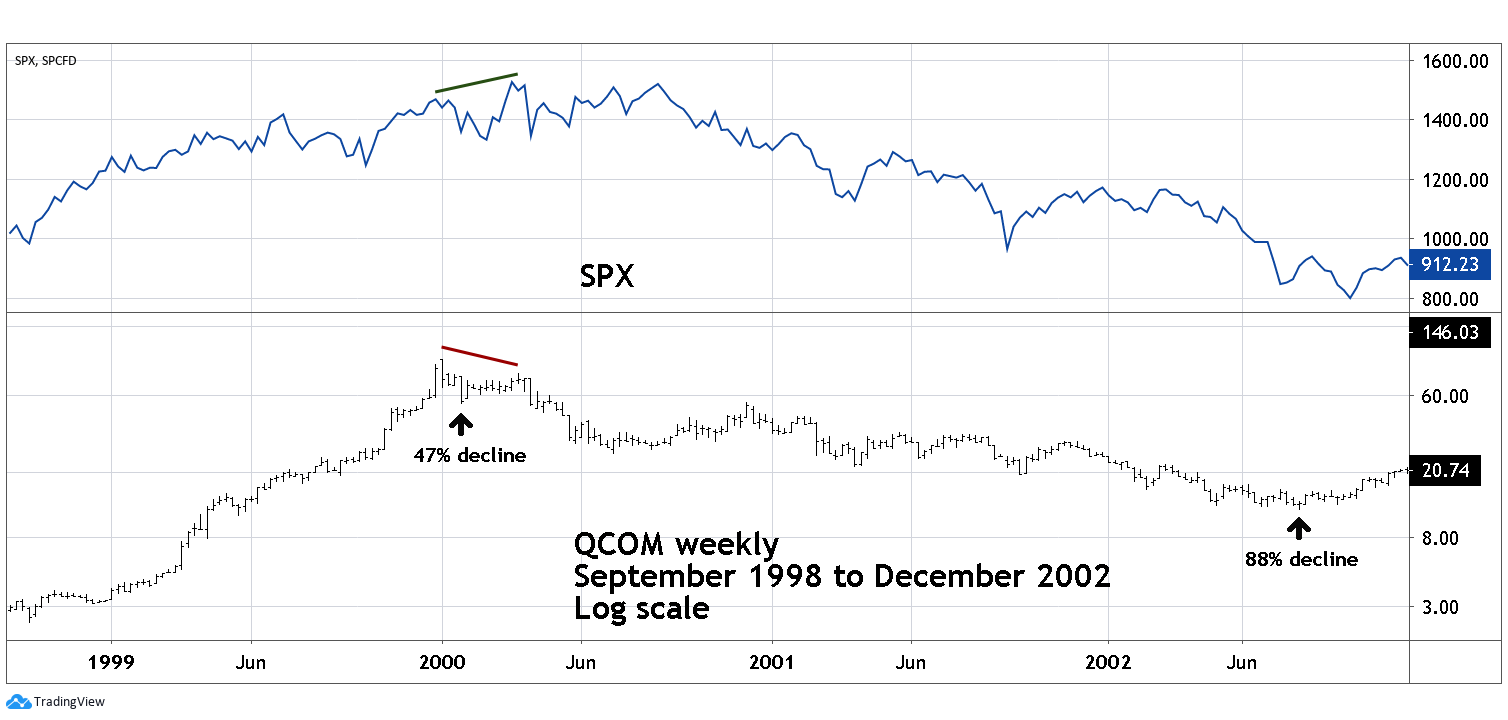
| During the great speculative stock mania of the late 1990's Qualcomm Inc. (QCOM) was one of the market leaders. This stocks peak made on the first trading day of 2000 was a caution sign for a looming bear mark. Twenty years later Zoom Video Communications (ZM) could be playing the same role. Qualcomm 1998-2002 My 07/09/20 article "Qualcomm - Twenty Year Double Top?" speculated that QCOM could find resistance at its all-time high of 100.00 made in January 2000. On 07/30/20 QCOM gapped above this resistance, the low that day was 100.76 — a classic example of a bullish breakout above major resistance. Since then the stock has continued to climb and was as of 11/20/20 up 46% from prior resistance at 100.00. The manner in which QCOM formed its early 2000 top could act as a guide for what could happen late 2020 to early 2021. Please see the weekly QCOM and S&P 500 (SPX) chart illustrated in Figure 1. After a fantastic huge rally in 1999 the QCOM bull move terminated on the first trading day of 2000 at 100.00. The subsequent 47% decline was larger than any correction throughout the 1999 rally. QCOM's initial move down ended on 01/28/00 about a month after its peak. The next rally failed to make a new all-time high while the SPX was making a new high. This bearish divergence between the broader market and a previously leading bullish stock was a significant signal the bull market in US stocks could be ending. After QCOM topped at 100.00 it was still a leading stock; it was leading the way down. |
|
| Figure 1. The manner in which QCOM formed its early 2000 top could act as a guide for what could happen late 2020 to early 2021. |
| Graphic provided by: TradingView. |
| |
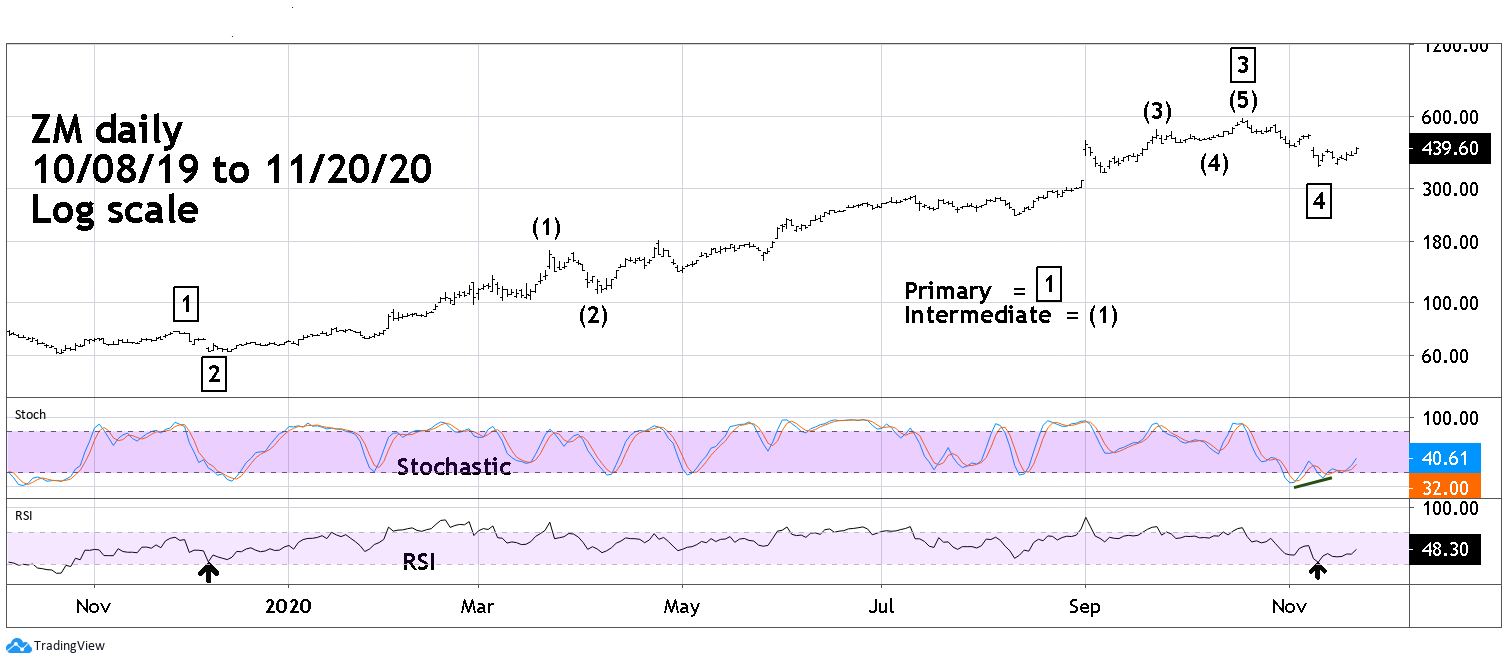
| Zoom 2019-2020 Please see the daily ZM chart illustrated in Figure 2. This is an update of the ZM chart illustrated in my 10/29/20 article "Zoom Video Communications: A 2020 Mania Stock". After ZM's 10/19/20 peak it declined 37%; the largest correction since the stock began its bull run in late 2019. Could this be similar to QCOM's initial bear move in early 2000? It's possible, however ZM had a 34% correction in April, the recent drop is not extraordinary. Analysis of ZM's Elliott Wave count and momentum indicators imply more upside action. The supposed Primary wave "4 - boxed" decline was 37.7%. The supposed Primary Wave "2 - boxed" fell 18.1% which is 48% of Primary wave "4" and close to a Fibonacci .50 relationship — common among waves "two and "four". Also, the bottom of Primary wave "4" had an RSI reading of 32%. The Primary wave "2" RSI reading was 33%. Near equality of oversold levels is what would be expected for waves of the same degree. Since 11/10/20 there have been two bullish signals: First, on 11/10/20, ZM daily Stochastic had a bullish divergence. Second, on 11/20/20, ZM was up 6.11% while the SPX declined 0.68%. If from late November to early December ZM breaks below the 11/10/20 bottom it increases the probabilities a major top could be place. |
|
| Figure 2. Analysis of ZM�s Elliott Wave count and momentum indicators imply more upside action. |
| Graphic provided by: TradingView. |
| |
| Roadmap for the market Powerful rising stocks failing to make new highs can be a warning sign for a bull market. QCOM in 2000 peaked almost three months before the SPX. ZM in 2020 is like QCOM in 1999, a mania stock and could give a similar bearish signal to what happened with QCOM in early 2000. If ZM's mid-October high holds it could be forecasting a significant US bull market peak sometime in January or February 2021. If ZM rallies and makes a new all-time high, it could be the prelude to a market top further into 2021. US stocks are seasonally bullish into late April. Whichever direction ZM takes in the next several weeks it could give valuable evidence regarding the broader US stock market direction. Further Reading: Frost A.J and Robert Prechter (1985) "Elliott Wave Principle", New Classics Library. |
Independent investment advisor, trader and writer. He has written articles for Technical Analysis of Stocks & Commodities, Traders.com Advantage,Futuresmag.com and, Finance Magnates. Author of website Four Dimension Trading.
| Website: | www.fourdimensiontrading.com |
| E-mail address: | markrivest@gmail.com |
Click here for more information about our publications!
PRINT THIS ARTICLE

Request Information From Our Sponsors
- StockCharts.com, Inc.
- Candle Patterns
- Candlestick Charting Explained
- Intermarket Technical Analysis
- John Murphy on Chart Analysis
- John Murphy's Chart Pattern Recognition
- John Murphy's Market Message
- MurphyExplainsMarketAnalysis-Intermarket Analysis
- MurphyExplainsMarketAnalysis-Visual Analysis
- StockCharts.com
- Technical Analysis of the Financial Markets
- The Visual Investor
- VectorVest, Inc.
- Executive Premier Workshop
- One-Day Options Course
- OptionsPro
- Retirement Income Workshop
- Sure-Fire Trading Systems (VectorVest, Inc.)
- Trading as a Business Workshop
- VectorVest 7 EOD
- VectorVest 7 RealTime/IntraDay
- VectorVest AutoTester
- VectorVest Educational Services
- VectorVest OnLine
- VectorVest Options Analyzer
- VectorVest ProGraphics v6.0
- VectorVest ProTrader 7
- VectorVest RealTime Derby Tool
- VectorVest Simulator
- VectorVest Variator
- VectorVest Watchdog