HOT TOPICS LIST
- MACD
- Fibonacci
- RSI
- Gann
- ADXR
- Stochastics
- Volume
- Triangles
- Futures
- Cycles
- Volatility
- ZIGZAG
- MESA
- Retracement
- Aroon
INDICATORS LIST
LIST OF TOPICS
PRINT THIS ARTICLE
by Mark Rivest
See why this stock could be a bearish signal for the US stock market.
Position: N/A
Mark Rivest
Independent investment advisor, trader and writer. He has written articles for Technical Analysis of Stocks & Commodities, Traders.com Advantage,Futuresmag.com and, Finance Magnates. Author of website Four Dimension Trading.
PRINT THIS ARTICLE
STOCKS
Qualcomm - Twenty-Year Double Top?
07/09/20 01:55:14 AMby Mark Rivest
See why this stock could be a bearish signal for the US stock market.
Position: N/A
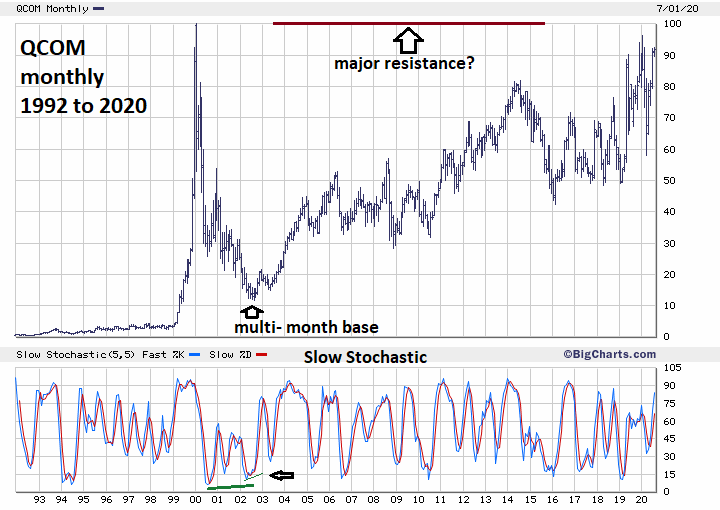
| Occasionally, stocks and markets will decline then retrace back to, or near, the prior peak followed by another drop. Double tops can happen on any time scale: daily, weekly, monthly, or even span several years. On January 3, 2000, Qualcomm reached the pinnacle of a massive buying panic and began a colossal decline. After over twenty-years Qualcomm is nearing its all-time high which could be major resistance. Qualcomm - Monthly Qualcomm designs and manufacture wireless telecommunication products and has more than 41,000 employees in 40 different countries. In the late 1990's its stock had one of the most spectacular rallies in history. Please see the monthly Qualcomm (QCOM) chart illustrated in Figure 1. From January 4, 1999 to January 3, 2000 QCOM increased more than twenty-seven times! By August 5, 2002 QCOM had declined more than 88%, a classic example of a buying mania and its result. Some stocks participating in the technology buying frenzy of 1999 to early 2000 went to zero. The monthly chart also shows the type of signals that could occur at a major bottom. Note how QCOM struggled to go lower as it entered the 14 to 12 zone. This created a double bullish divergence on the monthly Slow Stochastic. When you get buy signals on the monthly scale it's usually the prelude to a big bullish move, which is what happened. From mid-2002 to late 2004 QCOM rallied more than 280%. In mid-2020 the monthly Slow Stochastic upper line has exceeded 75%. If the lower line also exceeds 75% it could be signaling a top. |

|
| Figure 1. In mid–2020 the monthly Slow Stochastic upper line has exceeded 75%. If the lower line also exceeds 75% it could be signaling a top. |
| Graphic provided by: BigCharts.com. |
| |
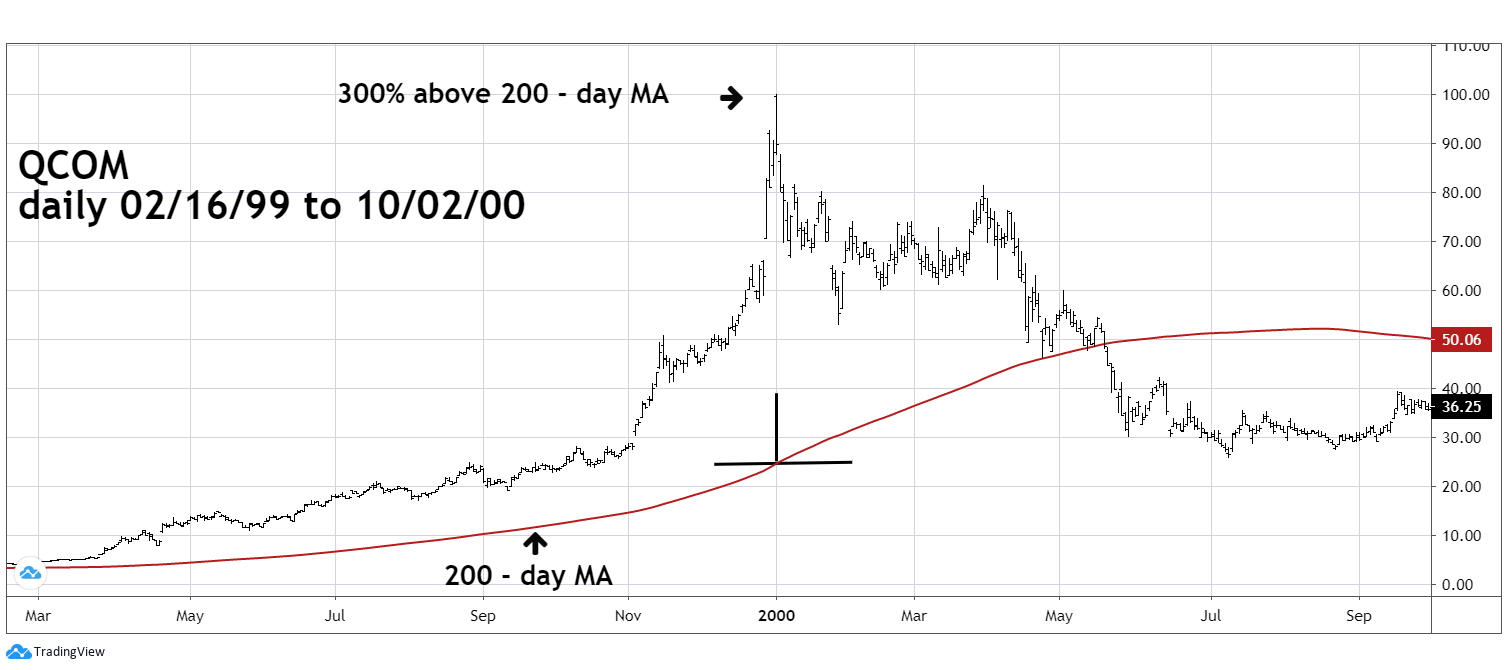
| Qualcomm - 1999 to 2000 Zooming in on QCOM's daily action from 1999 to 2000 reveals some fascinating factors. Please see the daily 1999 to 2000 QCOM chart illustrated in Figure 2. The incredible QCOM bull-move in 1999 blasted it 300% above its 200-day Moving Average (MA), one of the highest excesses in history. The 200-day MA would not have been effective in narrowing the top zone because about 40% of its rise came in the last five days of the bull run. Other factors contributed to narrowing the top zone. The late great Joseph Granville viewed stock movements as a matter of supply/demand. When stocks split it increased the supply of stock. He referred to splits as distribution and bearish. On May 11, 1999 QCOM had a two-for-one stock split. On December 31, 1999 QCOM had a four-for-one stock split. The second split tremendously increased the supply of QCOM just after a huge move up in price was a tip off of a nearing peak. Another factor is that sometimes stocks, or markets, could have a significant top/bottom on the cusp of a new year. A classic example is Japan's Nikkei 225 index which made its all-time high January 5, 1990 — the second trading day of the new year. The QCOM split and top is another example as it peaked on the first trading day of 2000. The final factor — climaxing exactly at 100.00. This was a rare example of a stock reaching an important price at an important time. |

|
| Figure 2. The incredible QCOM bull move in 1999 blasted it 300% above its 200–day Moving Average (MA), one of the highest excesses in history. |
| Graphic provided by: tradingview.com. |
| |
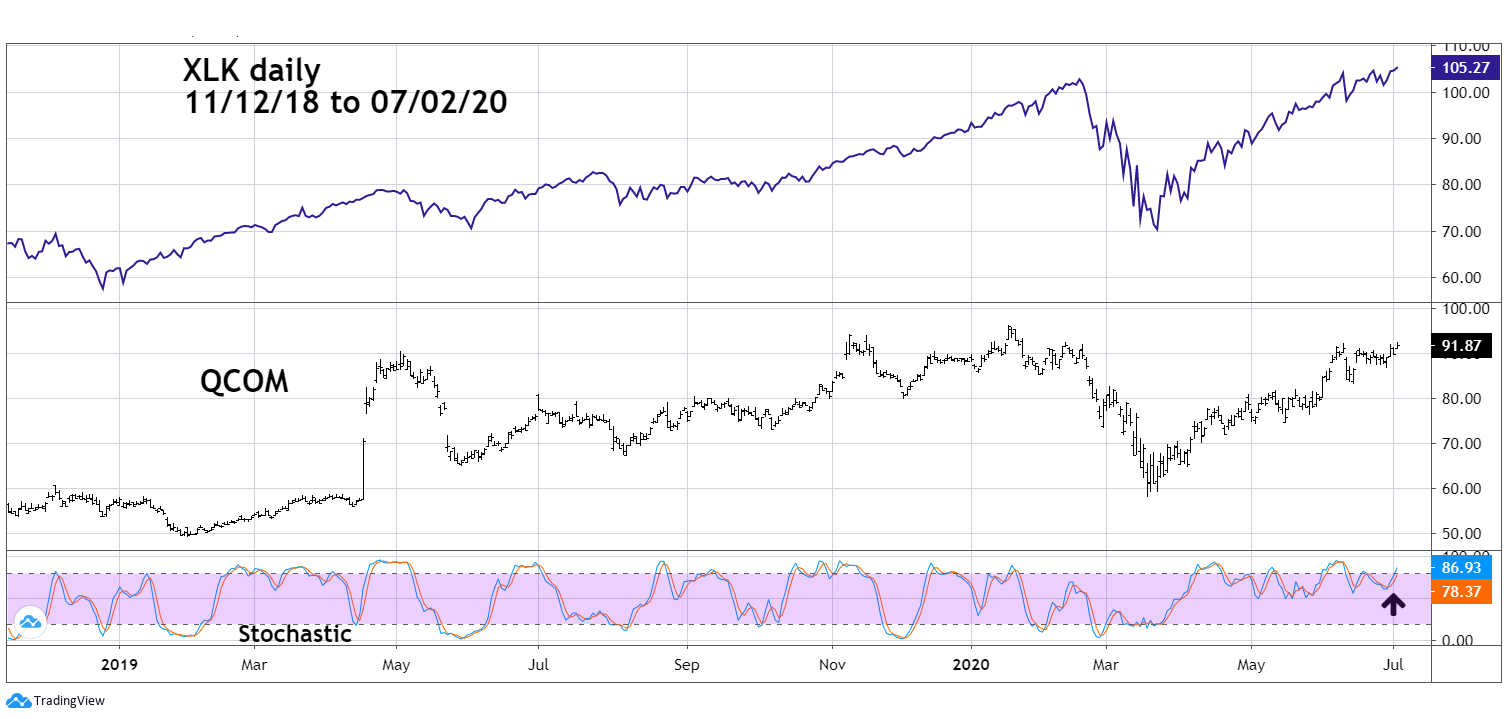
| QCOM 2020 Please see the daily QCOM and Technology - ETF fund (XLK) illustrated in Figure 3. The Technology Select Sector SPDR Fund XLK is one of the two sector ETF funds that have exceeded their February 2020 highs. QCOM is one of the component stocks within XLK and is lagging. However, QCOM is close to matching the S&P 500. Perhaps if QCOM tops at its 2000 high, the S&P 500 could peak at its February 2020 top. QCOM could be an important indicator in timing a significant turn of the broader stock market. As of July 2, QCOM's daily Stochastic had just broken into the overbought territory and indicates QCOM could have near-term bullish potential. |

|
| Figure 3. QCOM could be an important indicator in timing a significant turn of the broader stock market. |
| Graphic provided by: tradingview.com. |
| |
| Historical Significance QCOM's January 2000 top came close to two weeks before the Dow Jones Industrial Average major peak and over two months before the Nasdaq Composite historic high. If QCOM can reach its all-time high of 100.00 and stops, it could be the prelude to the next major bear market. Further Reading: Granville Joseph. E (1976) "Granville's New Strategy of Daily Stock Market Timing for Maximum Profit" Prentice - Hall, Inc. |
Independent investment advisor, trader and writer. He has written articles for Technical Analysis of Stocks & Commodities, Traders.com Advantage,Futuresmag.com and, Finance Magnates. Author of website Four Dimension Trading.
| Website: | www.fourdimensiontrading.com |
| E-mail address: | markrivest@gmail.com |
Click here for more information about our publications!
Comments
Date: 07/11/20Rank: 1Comment: The Tech sector is extremely cheap given the interest rate going to 0 and sub. So unlikely Qualcomm will go into bear market.

Request Information From Our Sponsors
- StockCharts.com, Inc.
- Candle Patterns
- Candlestick Charting Explained
- Intermarket Technical Analysis
- John Murphy on Chart Analysis
- John Murphy's Chart Pattern Recognition
- John Murphy's Market Message
- MurphyExplainsMarketAnalysis-Intermarket Analysis
- MurphyExplainsMarketAnalysis-Visual Analysis
- StockCharts.com
- Technical Analysis of the Financial Markets
- The Visual Investor
- VectorVest, Inc.
- Executive Premier Workshop
- One-Day Options Course
- OptionsPro
- Retirement Income Workshop
- Sure-Fire Trading Systems (VectorVest, Inc.)
- Trading as a Business Workshop
- VectorVest 7 EOD
- VectorVest 7 RealTime/IntraDay
- VectorVest AutoTester
- VectorVest Educational Services
- VectorVest OnLine
- VectorVest Options Analyzer
- VectorVest ProGraphics v6.0
- VectorVest ProTrader 7
- VectorVest RealTime Derby Tool
- VectorVest Simulator
- VectorVest Variator
- VectorVest Watchdog
