

HOT TOPICS LIST
- MACD
- Fibonacci
- RSI
- Gann
- ADXR
- Stochastics
- Volume
- Triangles
- Futures
- Cycles
- Volatility
- ZIGZAG
- MESA
- Retracement
- Aroon
INDICATORS LIST
LIST OF TOPICS
PRINT THIS ARTICLE
by Mark Rivest
See why this stock could continue to rise.
Position: N/A
Mark Rivest
Independent investment advisor, trader and writer. He has written articles for Technical Analysis of Stocks & Commodities, Traders.com Advantage,Futuresmag.com and, Finance Magnates. Author of website Four Dimension Trading.
PRINT THIS ARTICLE
ELLIOTT WAVE
Zoom Video Communications: A 2020 Mania Stock
10/29/20 03:17:12 PMby Mark Rivest
See why this stock could continue to rise.
Position: N/A
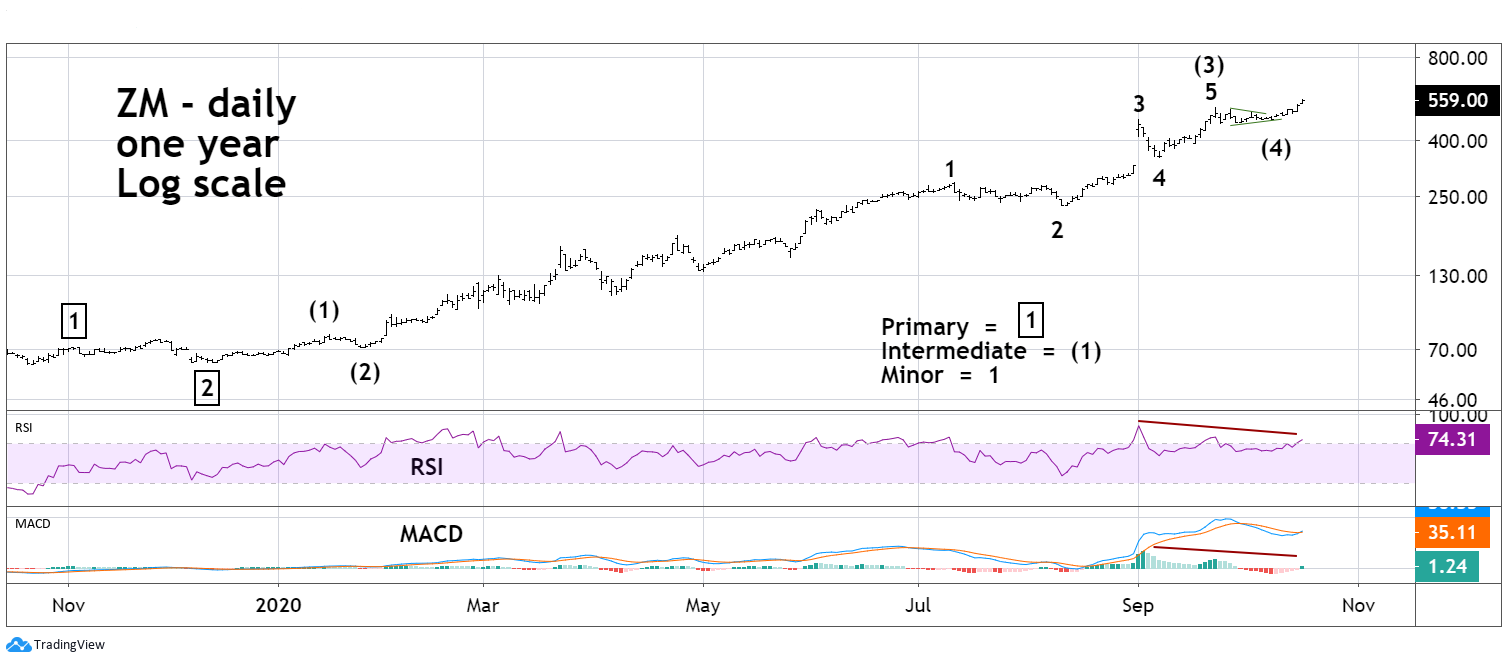
| Manias are a characteristic of stock bull markets; one or more areas will rise dramatically compared to the average stock. In the late 1990's and early 2000 internet stocks made spectacular gains. In 2020 video communication is the craze, and evidence indicates it could continue into at least late 2020. Zoom Video Communications - Daily Chart Social distancing resulting from the Coronavirus crisis has altered normal business and educational practices. Zoom Video Communications Inc. (ZM) has been a direct beneficiary of those changes. Please see the ZM daily chart illustrated in Figure 1. From the bottom made on October 23, 2019 to October 16, 2020, ZM has had more than an 800% gain! On the surface it would appear there may not be much more room for growth, however there are some interesting clues in the Elliott wave pattern. The clearest Elliott wave patterns are usually found in stock indices — they are a good representation of the mass mind. Individual stocks participating in a mania can also have clear Elliott wave patterns because of the intense mass emotions. ZM from its October 23, 2019 bottom appears to be forming an extended five-wave Elliott impulse pattern. The most dynamic movement within an Elliott wave impulse is called the "point of recognition" and it occurs at the exact center of an extended impulse wave. Point of recognition is where the vast majority of the crowd recognizes the primary trend, which in this case is up. ZM's point of recognition came on September 1, 2020, with a large gap up. The next Elliott wave clue comes from the late September to early October sideways correction labeled Intermediate wave (4). This appears to be an Elliott Wave Horizontal Triangle which only happen in the fourth wave position of five-wave motive patterns. As of the high made on October 16 there are bearish momentum divergences on the daily RSI and MACD. This could be a signal of a pending significant decline, however, when stocks/markets are within dynamic moves it's common to have several momentum divergence. A view of the next higher scale is needed to get the proper perspective. |
|
| Figure 1. ZM�s point of recognition came on September 1, 2020 with a large gap up. |
| Graphic provided by: TradingView. |
| |
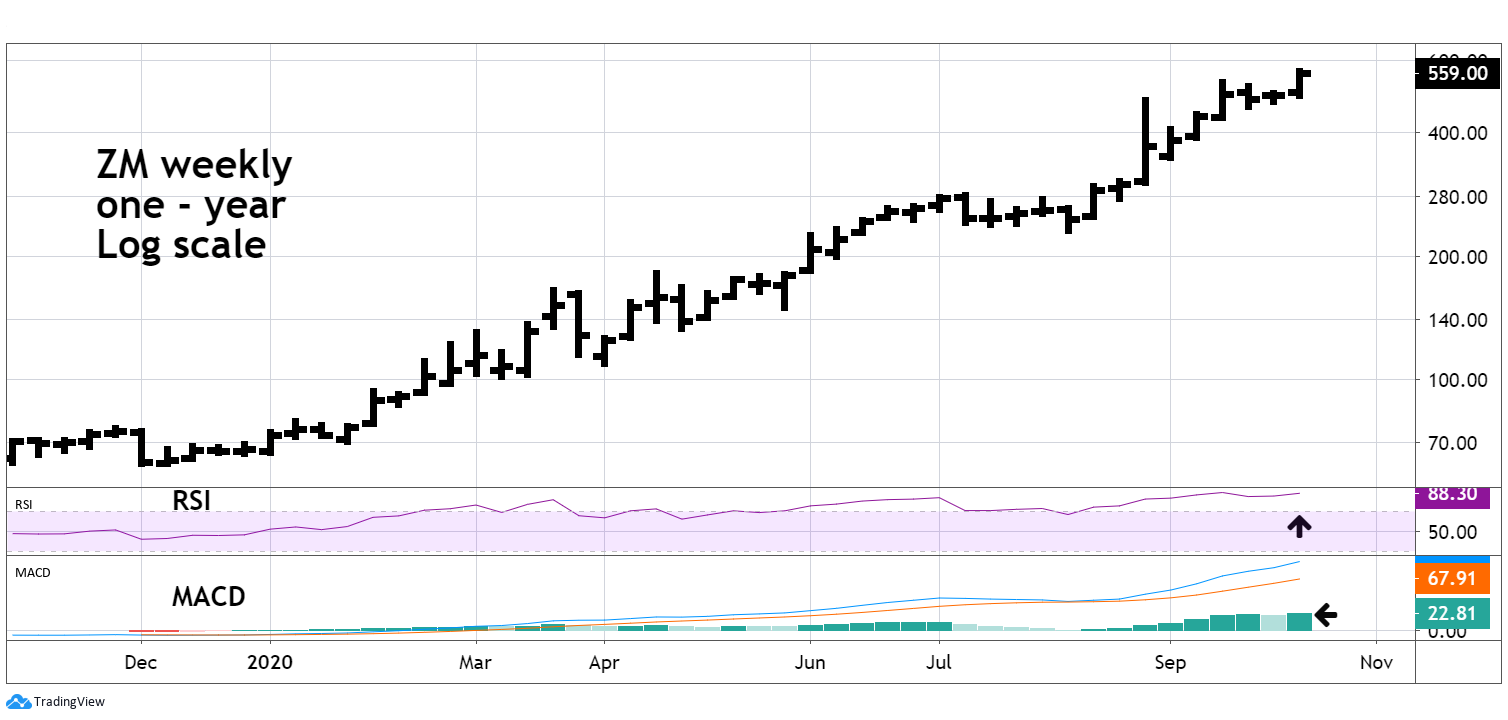
| Zoom Video Communications - Weekly Chart Please see the weekly ZM chart illustrated in Figure 2. The weekly RSI as of October 16 was 88.30, almost the same level of 89.07 recorded on the week ending September 21. As of October 16, the weekly MACD was at its highest level; these readings imply ZM could rise for several more weeks. The daily bearish divergences suggest that perhaps a short-term peak could be forming in mid-October. If so, a subsequent decline could set up a buying opportunity. |
|
| Figure 2. As of October 16,the weekly MACD was at its highest level. |
| Graphic provided by: TradingView. |
| |
| Strategy If ZM has a peak in mid-October it would be labeled Primary wave "3" boxed. The subsequent decline could be Primary wave "4". Wave "fours" usually retrace to the next lower degree fourth wave which in this case is the correction labeled Intermediate degree (4). The target zone for a potential bottom is between 460 and 510. A move below the supposed Horizontal Triangle's low point at 457.69 could endanger the bullish scenario. Even if you are not interested in trading ZM there's another reason to follow the stock. Mania stocks typically will reach their ultimate peak around the time the broader stock market is topping. Please see my July 9, 2020 article "Qualcomm - Twenty-Year Double Top?" In early 2000 QCOM's high came within two weeks of the Dow Jones Industrial Average final peak. If the Elliott wave pattern illustrated in figure 1 completes within the next several weeks, it could provide a powerful signal that the bull run from at least March 2020 is near an end. Further Reading: Frost A.J and Robert Prechter (1985) "Elliott Wave Principle", New Classics Library. |
Independent investment advisor, trader and writer. He has written articles for Technical Analysis of Stocks & Commodities, Traders.com Advantage,Futuresmag.com and, Finance Magnates. Author of website Four Dimension Trading.
| Website: | www.fourdimensiontrading.com |
| E-mail address: | markrivest@gmail.com |
Click here for more information about our publications!
PRINT THIS ARTICLE

Request Information From Our Sponsors
- VectorVest, Inc.
- Executive Premier Workshop
- One-Day Options Course
- OptionsPro
- Retirement Income Workshop
- Sure-Fire Trading Systems (VectorVest, Inc.)
- Trading as a Business Workshop
- VectorVest 7 EOD
- VectorVest 7 RealTime/IntraDay
- VectorVest AutoTester
- VectorVest Educational Services
- VectorVest OnLine
- VectorVest Options Analyzer
- VectorVest ProGraphics v6.0
- VectorVest ProTrader 7
- VectorVest RealTime Derby Tool
- VectorVest Simulator
- VectorVest Variator
- VectorVest Watchdog
- StockCharts.com, Inc.
- Candle Patterns
- Candlestick Charting Explained
- Intermarket Technical Analysis
- John Murphy on Chart Analysis
- John Murphy's Chart Pattern Recognition
- John Murphy's Market Message
- MurphyExplainsMarketAnalysis-Intermarket Analysis
- MurphyExplainsMarketAnalysis-Visual Analysis
- StockCharts.com
- Technical Analysis of the Financial Markets
- The Visual Investor