

HOT TOPICS LIST
- MACD
- Fibonacci
- RSI
- Gann
- ADXR
- Stochastics
- Volume
- Triangles
- Futures
- Cycles
- Volatility
- ZIGZAG
- MESA
- Retracement
- Aroon
INDICATORS LIST
LIST OF TOPICS
PRINT THIS ARTICLE
by Mark Rivest
Simultaneous all-time highs for S&P 500 and Nasdaq could be a bullish signal.
Position: N/A
Mark Rivest
Independent investment advisor, trader and writer. He has written articles for Technical Analysis of Stocks & Commodities, Traders.com Advantage,Futuresmag.com and, Finance Magnates. Author of website Four Dimension Trading.
PRINT THIS ARTICLE
MOMENTUM
Stock Indices Converging
08/14/20 03:23:59 PMby Mark Rivest
Simultaneous all-time highs for S&P 500 and Nasdaq could be a bullish signal.
Position: N/A
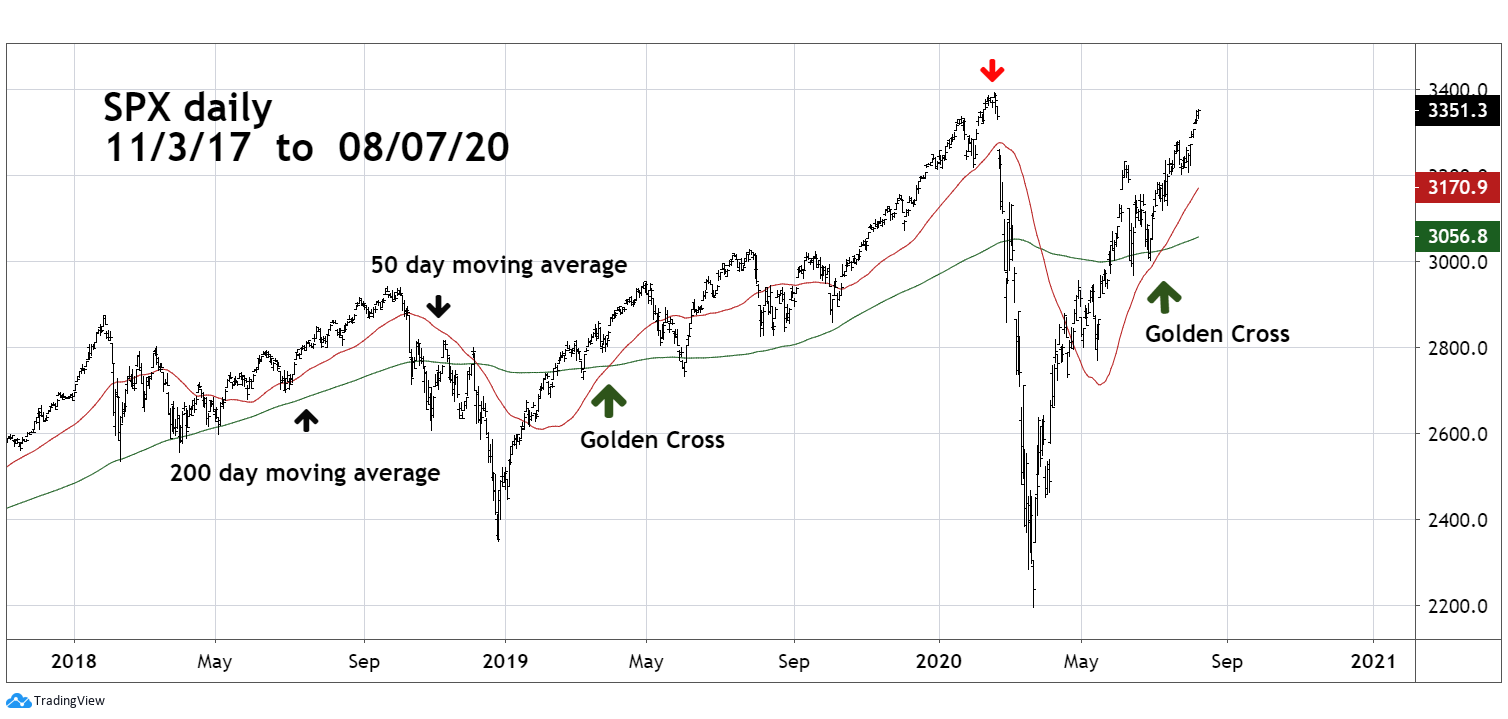
| In mid-July the rally in US stocks appeared to be faltering. My July 30 article "Stock Index Divergence" noted the S&P 500 (SPX) made a new post-crash rally high unaccompanied by the other two main US stock indices. Additionally, the SPX appeared to be forming an Elliott Wave Ending Diagonal Triangle (EDT). At the July 23 high the pattern appeared complete, subsequently there was a very brief drop followed by a move above the suppose EDT top invaliding the pattern. This upside breakthrough could be very bullish. Golden Cross Signal Trading signals can be generated by using two or more moving averages (MA). Use of the 50-day and 200-day moving averages is a popular combination. When the 50-day MA crosses below the 200-day MA it's bearish and referred to as a Death Cross. A move of the 50-day MA above the 200-day MA is a bullish Golden Cross. Because stocks usually fall faster than they rise Death Cross signals can frequently be ineffective. Golden Cross signals have a higher probability for success. Please see the Daily SPX chart 2017 to 2020 illustrated in Figure 1. Note the Death Cross signal in late 2018. However, a trader needed to be nimble as the subsequent decline only lasted about two weeks. The Death Cross signal in March 2020 came after the bottom had been made. My April 18, 2019 article "The Golden Cross" noted that since the March 2009 SPX bottom the weakest successful Golden Cross signal forecasted a rally that lasted six months with a gain of 22%. Projecting these results to the April 1, 2019 Golden Cross signal forecasted the SPX could reach 3365 by September 2019. In February 2020, the SPX topped at 3393. Projecting a 22% gain in six months to the recent Golden Cross signal on July 8 at SPX 3028 forecasts an SPX peak of 3694 in January 2021. |
|
| Figure 1. Projecting a 22% gain in six months to the recent Golden Cross signal on July 8 at SPX 3028 forecasts an SPX peak of 3694 in January 2021. |
| Graphic provided by: TradingView. |
| |
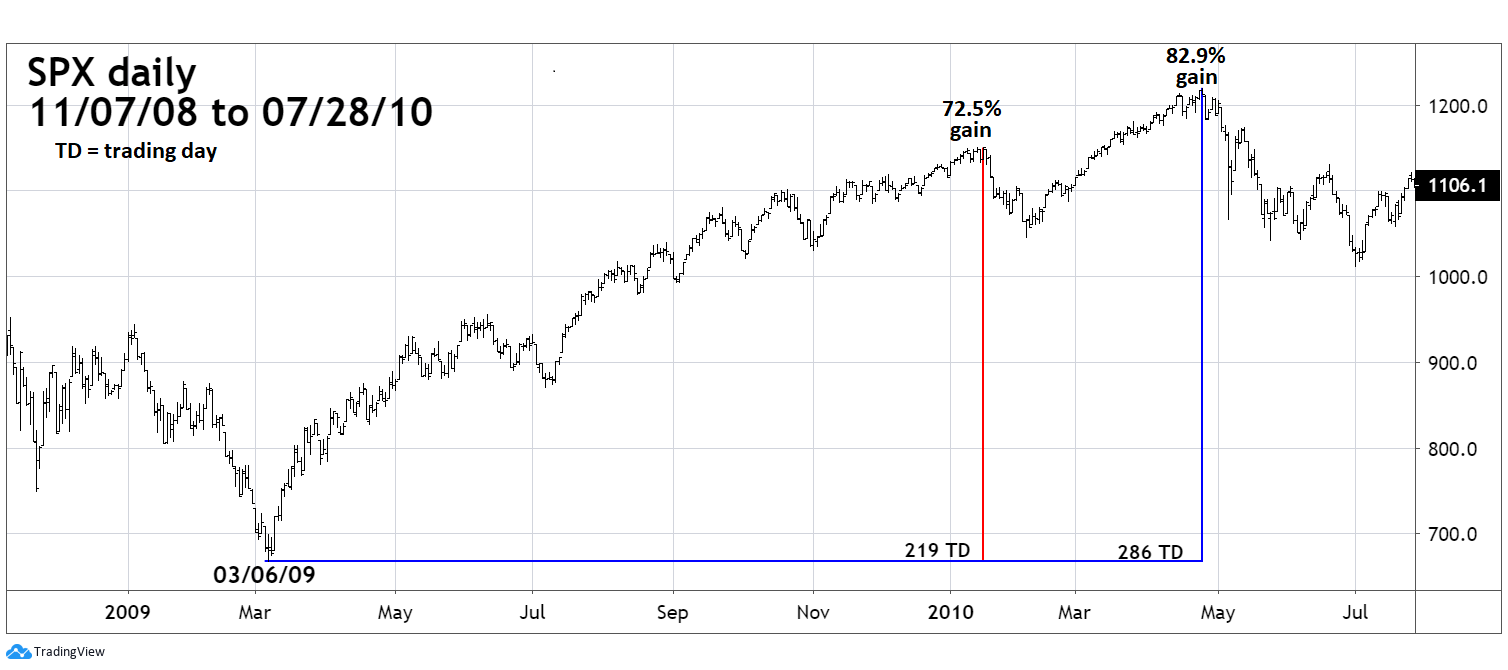
| Blow Off Top? Most stock bull markets have the strongest growth immediately after the conclusion of bear markets. In multi-year bull movements the rate of ascent decreases, with the weakest increase during the bull market termination phase. A notable exception was the Nasdaq 1999 to early 2000 peak. The SPX activity since the March 23 crash bottom resembles the kickoff rally of the secular bull market that began March 2009. Please see the daily SPX chart 2008 to 2010 illustrated in Figure 2. The first phase of the secular bull market lasted from March 2009 to April 2010. The penultimate top in January 2010 registered a 72.5% SPX gain from the bear market nadir of 666. The termination point of the first bull phase in April 2010 saw the SPX with an 82.9% increase. Projecting a gain of 72.5% from the March 2020 bottom at 2191 targets a possible SPX top at 3780 in January 2021. If the current bull phase from March 2020 can match the first phase of the secular bull market it forecasts a peak at 4010 in April 2021. |
|
| Figure 2. Projecting a gain of 72.5% from the March 2020 bottom at 2191 targets a possible SPX top at 3780 in January 2021. |
| Graphic provided by: TradingView. |
| |
| Convergence? My July 30 article noted that major bull markets tops in 2000 and 2007 terminated when only one of the three main US stock indices (SPX, Dow Jones Industrial Average, and Nasdaq Composite) were making a new all-time high. Since mid-June 2020 only the Nasdaq Composite has been able to reach a new all-time high — a potentially bearish factor. This could change soon. On August 7, the SPX came within 41 points of its all-time high recorded in February. If the SPX can exceed its February peak it could be another bullish signal, implying the rally continues for weeks or months. The Golden Cross signal combined with a rapid rate of ascent suggests US stocks could be in the middle of a bull phase that began in March 2020. Big moves up in the stock market don't happen often, to make big profits you have to let them run. It's hard to enter a position, and sometimes it's harder to hold. |
Independent investment advisor, trader and writer. He has written articles for Technical Analysis of Stocks & Commodities, Traders.com Advantage,Futuresmag.com and, Finance Magnates. Author of website Four Dimension Trading.
| Website: | www.fourdimensiontrading.com |
| E-mail address: | markrivest@gmail.com |
Click here for more information about our publications!
PRINT THIS ARTICLE

Request Information From Our Sponsors
- StockCharts.com, Inc.
- Candle Patterns
- Candlestick Charting Explained
- Intermarket Technical Analysis
- John Murphy on Chart Analysis
- John Murphy's Chart Pattern Recognition
- John Murphy's Market Message
- MurphyExplainsMarketAnalysis-Intermarket Analysis
- MurphyExplainsMarketAnalysis-Visual Analysis
- StockCharts.com
- Technical Analysis of the Financial Markets
- The Visual Investor
- VectorVest, Inc.
- Executive Premier Workshop
- One-Day Options Course
- OptionsPro
- Retirement Income Workshop
- Sure-Fire Trading Systems (VectorVest, Inc.)
- Trading as a Business Workshop
- VectorVest 7 EOD
- VectorVest 7 RealTime/IntraDay
- VectorVest AutoTester
- VectorVest Educational Services
- VectorVest OnLine
- VectorVest Options Analyzer
- VectorVest ProGraphics v6.0
- VectorVest ProTrader 7
- VectorVest RealTime Derby Tool
- VectorVest Simulator
- VectorVest Variator
- VectorVest Watchdog