

HOT TOPICS LIST
- MACD
- Fibonacci
- RSI
- Gann
- ADXR
- Stochastics
- Volume
- Triangles
- Futures
- Cycles
- Volatility
- ZIGZAG
- MESA
- Retracement
- Aroon
INDICATORS LIST
LIST OF TOPICS
PRINT THIS ARTICLE
by Mark Rivest
How effective is an S&P 500 Golden Cross signal? On April 1, 2019, the S&P 500 (SPX) 50-day Simple Moving Average (SMA) crossed above the 200-day SMA, known as a Golden Cross. This is only the sixth such signal since the major US stock market bottom made in March of 2009. Study of the prior five signals reveal clues as to what we could expect for the most recent crossing.
Position: N/A
Mark Rivest
Independent investment advisor, trader and writer. He has written articles for Technical Analysis of Stocks & Commodities, Traders.com Advantage,Futuresmag.com and, Finance Magnates. Author of website Four Dimension Trading.
PRINT THIS ARTICLE
MOVING AVERAGES
The Golden Cross
04/18/19 05:16:07 PMby Mark Rivest
How effective is an S&P 500 Golden Cross signal? On April 1, 2019, the S&P 500 (SPX) 50-day Simple Moving Average (SMA) crossed above the 200-day SMA, known as a Golden Cross. This is only the sixth such signal since the major US stock market bottom made in March of 2009. Study of the prior five signals reveal clues as to what we could expect for the most recent crossing.
Position: N/A
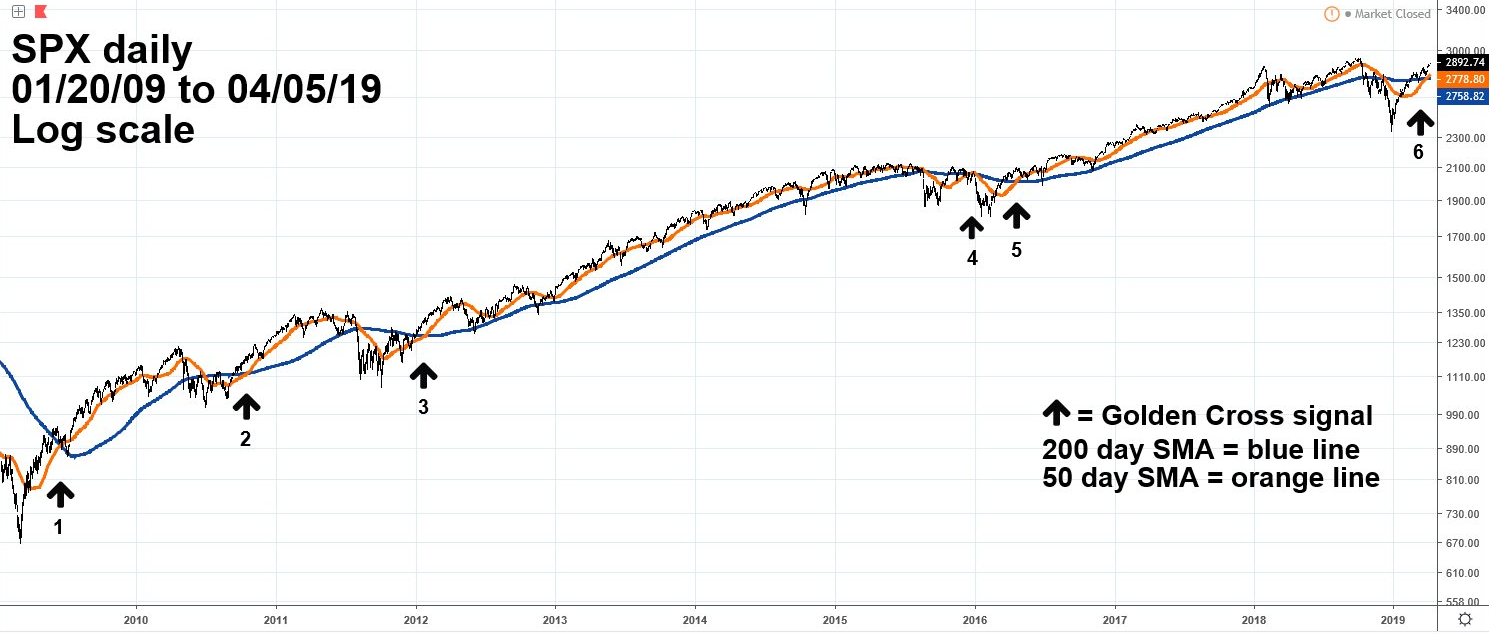
| S & P 500 - 2009 to 2019 Stock markets naturally have long and steady rises, while declines are sharp and fast. This factor makes Golden Cross signals much more effective than its cousin, the Death Cross. A Death Cross occurs when the 50-day SMA crosses below the 200-day SMA. My April 19, 2018 article, "The Death Cross", noted that this signal was effective only 20% of the time on the SPX from 2009 to 2016. The results for the Golden Cross are significantly different. Please see the daily SPX chart 2009 to 2019 illustrated in Figure 1. From 2009 to 2016 there were five signals. These are the results of what the SPX did after the signal and the highest level achieved before a Death Cross signal. 1) 06/23/09 to 04/27/10 - 35% gain in 10 months. 2) 10/21/10 to 05/02/11 - 22% gain in 6 months. 3) 01/30/12 to 05/21/15 - 69% gain in 40 months. 4) 12/21/15 to 12/29/15 - no gain. 5) 04/21/16 to 09/21/18 - 46% gain in 29 months. The results from the Golden Cross are the inverse of the Death Cross — 80% effective. Does this mean it's clear sailing upwards after the April 1, 2019 signal? Absolutely not. Note that the one Golden Cross failure occurred after only 8 days as the SPX was in the area just below its then all-time high. As of April 5, 2019, the current signal is only 5 days old. The SPX high on April 5 was 2893, only 1.6% from the all-time high of 2940. If the SPX was to decline and trigger a Death Cross in April it could be a very bearish signal. |
|
| Fgiure 1. Stock markets naturally have long and steady rises, while declines are sharp and fast. This factor makes a Golden Cross signal much more effective than its cousin, the Death Cross. |
| Graphic provided by: tradingview.com. |
| |
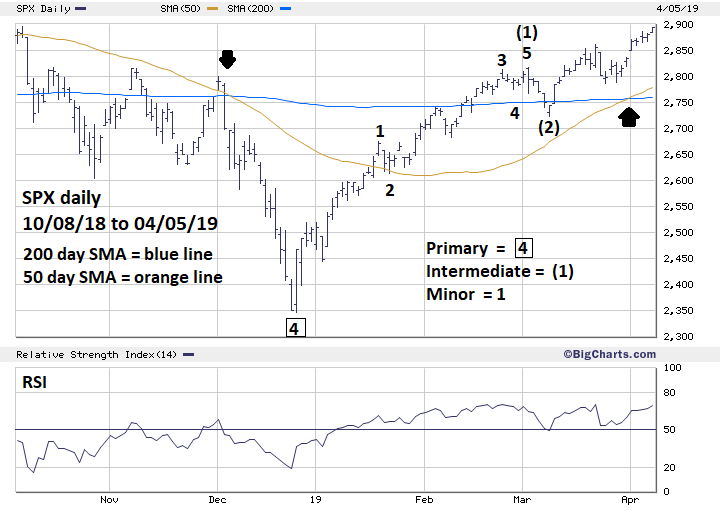
| S&P 500 - October 2018 to April 2019 Please see the daily SPX chart illustrated in Figure 2. The most recent Death Cross signal generated on December 6, 2018 was effective with the SPX falling 12%. However, you had to be nimble as a major bottom was registered after just 12 trading days. The subsequent powerful rally appears to have completed an Elliott five-wave impulse which terminated on March 4; the subsequent decline was the longest and deepest since the start of the rally on December 26. Dropping 3.3% in 4 trading days makes this decline a good candidate for Intermediate wave (2). Reasons to suspect the SPX could continue beyond 2893 are as follows: 1) US stocks are seasonally bullish until early May 2) SPX has broken above considerable resistance that formed the triple top in the 2800 to 2816 area. There is no significant chart or Fibonacci resistance until the all-time high at 2940. 3) Major round number resistance of SPX 3000 could act as a magnet pulling prices higher. |
|
| Figure 2. The powerful rally appears to have completed an Elliott five-wave impulse which terminated on March 4. |
| Graphic provided by: BigCharts.com. |
| |
| Conclusion The weakest effective Gold Cross signal since 2009 has been 22% in 6 months. If the current signal matches that gain the SPX could reach 3365 sometime in September 2019. There are two factors that could deter this outcome. US stocks are seasonally bearish from early May to early November. Additionally, there's potentially major Fibonacci resistance at SPX 3047, which was first discussed in my February 1, 2018 article, "How High is Up?" This level was calculated by taking the length of the SPX 2007 to 2009 bear market of 909.30 multiplied by the Fibonacci ratio of 2.618 which yields 2380.54, added to the major SPX bottom at 666.79 targets 3047.33. Most, if not all, US stock fund managers base their performance on the SPX. A very reliable signal like the Golden Cross will probably trigger new long purchases. Unless the SPX has a Death Cross in April, the path of least resistance is up. The big question remains — how high is up? Perhaps we'll have that answer in May. Further Reading: Frost A.J and Robert Prechter (1985) "Elliott Wave Principle", New Classics Library. |
Independent investment advisor, trader and writer. He has written articles for Technical Analysis of Stocks & Commodities, Traders.com Advantage,Futuresmag.com and, Finance Magnates. Author of website Four Dimension Trading.
| Website: | www.fourdimensiontrading.com |
| E-mail address: | markrivest@gmail.com |
Click here for more information about our publications!
Comments
Date:�04/19/19Rank:�5Comment:�

Request Information From Our Sponsors
- StockCharts.com, Inc.
- Candle Patterns
- Candlestick Charting Explained
- Intermarket Technical Analysis
- John Murphy on Chart Analysis
- John Murphy's Chart Pattern Recognition
- John Murphy's Market Message
- MurphyExplainsMarketAnalysis-Intermarket Analysis
- MurphyExplainsMarketAnalysis-Visual Analysis
- StockCharts.com
- Technical Analysis of the Financial Markets
- The Visual Investor
- VectorVest, Inc.
- Executive Premier Workshop
- One-Day Options Course
- OptionsPro
- Retirement Income Workshop
- Sure-Fire Trading Systems (VectorVest, Inc.)
- Trading as a Business Workshop
- VectorVest 7 EOD
- VectorVest 7 RealTime/IntraDay
- VectorVest AutoTester
- VectorVest Educational Services
- VectorVest OnLine
- VectorVest Options Analyzer
- VectorVest ProGraphics v6.0
- VectorVest ProTrader 7
- VectorVest RealTime Derby Tool
- VectorVest Simulator
- VectorVest Variator
- VectorVest Watchdog