

HOT TOPICS LIST
- MACD
- Fibonacci
- RSI
- Gann
- ADXR
- Stochastics
- Volume
- Triangles
- Futures
- Cycles
- Volatility
- ZIGZAG
- MESA
- Retracement
- Aroon
INDICATORS LIST
LIST OF TOPICS
PRINT THIS ARTICLE
by Mark Rivest
See why the S&P 500 July 15 high could signal a decline.
Position: N/A
Mark Rivest
Independent investment advisor, trader and writer. He has written articles for Technical Analysis of Stocks & Commodities, Traders.com Advantage,Futuresmag.com and, Finance Magnates. Author of website Four Dimension Trading.
PRINT THIS ARTICLE
ELLIOTT WAVE
Stock Index Divergence
07/30/20 04:02:39 PMby Mark Rivest
See why the S&P 500 July 15 high could signal a decline.
Position: N/A
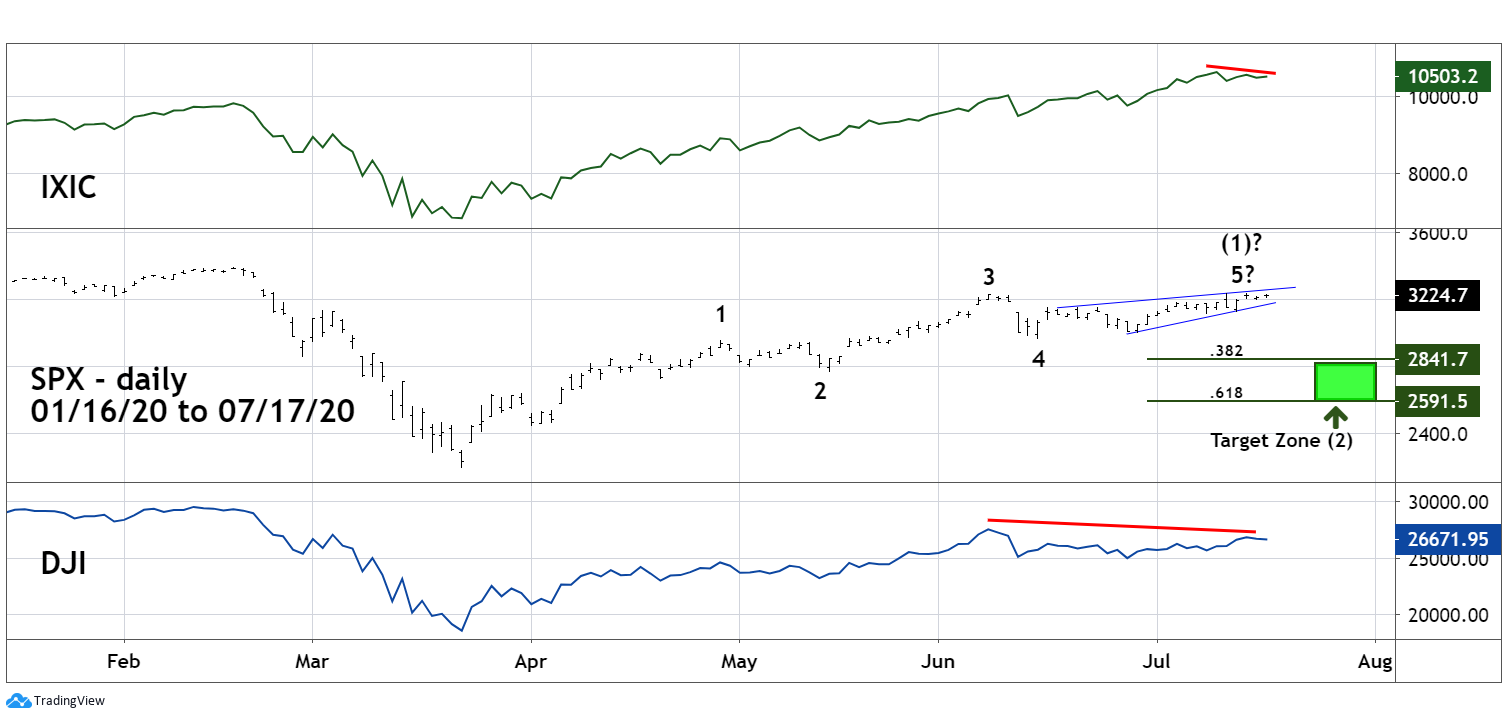
| When the Dow Theory was developed, one of the main aspects was that a divergence between the Industrial index and the Rail index, now called Transportation index, could be the prelude to a significant stock market trend change. The economy and stock market have changed dramatically since Dow Theory was first used. In the Twenty-First century, perhaps a better method to detect US stock market trend changes is an examination of the three main US stock indices. Three Main Indices Dow Jones Industrial Average (DJI), S&P 500 (SPX), and Nasdaq Composite (IXIC) are the three most watched US stock indices. When they travel in harmony it confirms the main trend, while divergences could indicate a coming trend change. In January 2000, all three main US stock indices were making all-time highs. On March 24, 2000 only the SPX made a new all-time high; what followed was a thirty-one month bear market. After the 2000 to 2002 bear market, US stocks had a five-year bull run which ended in October 2007. On October 31, 2007 IXIC made its bull market peak unaccompanied by the SPX and DJI and marked the commencement of a seventeen-month bear run. Since June 20, 2020, the IXIC has been the only main US stock index to make a new all-time high, a potentially bearish signal. On July 15 there was another divergence. Please see the SPX, DJI, and IXIC daily chart illustrated in Figure 1. Since the crash bottom on March 23 all three main indices had been rising in harmony until early June when DJI made its so far post-crash high. On July 13 SPX and IXIC made post-crash rally highs. Then on July 15 only the SPX made a new post-crash high. This factor by itself is curious because you would expect the strongest index - IXIC to be the last to peak. Additionally, the SPX may have completed, or could soon complete, an Elliott five-wave pattern from the March 23 bottom. If a decline develops, retracements of five-wave patterns after a significant turn are usually in the area of .382 to .618. |
|
| Figure 1. On July 15 only the SPX made a new post-crash high. |
| Graphic provided by: tradingview.com. |
| |
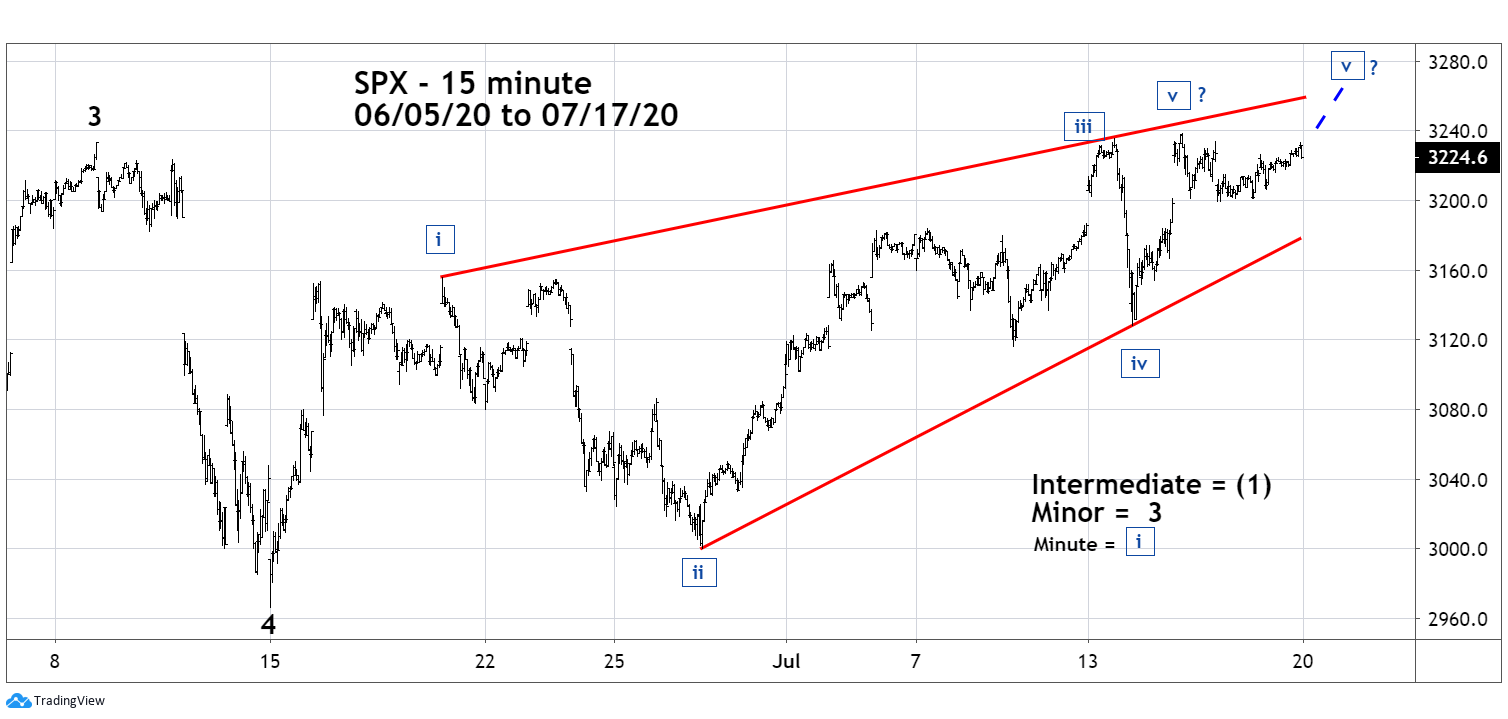
| Intraday Pattern An examination of the SPX intraday pattern from the June 15 bottom provides additional clues of a potential bearish move. Please see the SPX 15-minute chart illustrated in Figure 2. Since the June 15 bottom the SPX may have completed, or is completing, an Elliott Wave Ending Diagonal Triangle (EDT). This formation appears only in the fifth wave position of motive waves and in "C" waves of corrective patterns. R.N Elliott noted that EDT's occur when the preceding move has gone "too far, too fast", which accurately describes the rally since the March crash bottom. EDT's are wedge formations and all five sub-waves divide into three-wave structures. Wave four within an EDT almost always travels into the area of wave one. Most of the time the third wave of an EDT is shorter than the first; the supposed EDT in this illustration is an exception to that guideline. EDT's usually climax with a throw-over of the trendline connecting the termination points of wave one and three, again there are exceptions to guidelines. As of July 17, it's possible the EDT could still be forming. If so, it may terminate on the 20th or 21st of July. |
|
| Figure 2. Since the June 15 bottom the SPX may have completed, or is completing, an Elliott Wave Ending Diagonal Triangle (EDT). |
| Graphic provided by: tradingview.com. |
| |
| Major Turn? On all time scales there are always alternate Elliott Wave interpretations. The SPX pattern illustrated in Figure 1 implies an intermediate peak forming or formed followed by a correction and then resumption of the bull run to new post-crash highs. There is an alternate count that suggests any near-term top could be the start of a decline that moves below the March crash bottom. A breach of that important support could come before the end of 2020. As of mid-July 2020 it's unclear if even a near-term high is being made, therefore, if necessary, the examination of a more bearish alternative will be discussed later. The strongest piece of evidence that suggests that US stocks could continue to make post-crash rally highs into at least late 2020 comes from the Market Vane Bullish Consensus. Market Vane Corporation measures the sentiment of several Futures markets. They do this by following the trading recommendations of leading Commodity Trading Advisors. The scale of their readings range from 1 to 100, where low numbers indicate bearishness and high numbers show bullishness. Important market tops/bottom usually have extreme readings. For US stocks important tops can form when Bullish Consensus readings are in the range of 60 to 70%. Major bottoms are usually accompanied by readings below 30%. The highest Bullish Consensus reading for 2020 came during the week of January 21 at 53%. The lowest reading this year was 28% made during the week of the crash bottom. The highest post-crash reading has been 41% made during the week of July 13 to 17 while the SPX was making its post-crash high. While this reading could indicate a near-term top, it would be unusual for a major peak to be made while the majority of Commodity Trading Advisors for stocks are bearish. Trading action in next few weeks could yield clues to the primary direction of US stocks. Further Reading: Frost A.J and Robert Prechter (1985) "Elliott Wave Principle", New Classics Library. Hadady R. Earl (1983) "Contrary Opinion", Key Books. |
Independent investment advisor, trader and writer. He has written articles for Technical Analysis of Stocks & Commodities, Traders.com Advantage,Futuresmag.com and, Finance Magnates. Author of website Four Dimension Trading.
| Website: | www.fourdimensiontrading.com |
| E-mail address: | markrivest@gmail.com |
Click here for more information about our publications!
PRINT THIS ARTICLE

Request Information From Our Sponsors
- VectorVest, Inc.
- Executive Premier Workshop
- One-Day Options Course
- OptionsPro
- Retirement Income Workshop
- Sure-Fire Trading Systems (VectorVest, Inc.)
- Trading as a Business Workshop
- VectorVest 7 EOD
- VectorVest 7 RealTime/IntraDay
- VectorVest AutoTester
- VectorVest Educational Services
- VectorVest OnLine
- VectorVest Options Analyzer
- VectorVest ProGraphics v6.0
- VectorVest ProTrader 7
- VectorVest RealTime Derby Tool
- VectorVest Simulator
- VectorVest Variator
- VectorVest Watchdog
- StockCharts.com, Inc.
- Candle Patterns
- Candlestick Charting Explained
- Intermarket Technical Analysis
- John Murphy on Chart Analysis
- John Murphy's Chart Pattern Recognition
- John Murphy's Market Message
- MurphyExplainsMarketAnalysis-Intermarket Analysis
- MurphyExplainsMarketAnalysis-Visual Analysis
- StockCharts.com
- Technical Analysis of the Financial Markets
- The Visual Investor