

HOT TOPICS LIST
- MACD
- Fibonacci
- RSI
- Gann
- ADXR
- Stochastics
- Volume
- Triangles
- Futures
- Cycles
- Volatility
- ZIGZAG
- MESA
- Retracement
- Aroon
INDICATORS LIST
LIST OF TOPICS
PRINT THIS ARTICLE
by Mark Rivest
Stocks, Gold, and Crude Oil could be at, or nearing, important reversal points.
Position: N/A
Mark Rivest
Independent investment advisor, trader and writer. He has written articles for Technical Analysis of Stocks & Commodities, Traders.com Advantage,Futuresmag.com and, Finance Magnates. Author of website Four Dimension Trading.
PRINT THIS ARTICLE
POINT & FIGURE
Finding Support/Resistance With Point & Figure Charts
07/01/20 06:03:03 PMby Mark Rivest
Stocks, Gold, and Crude Oil could be at, or nearing, important reversal points.
Position: N/A
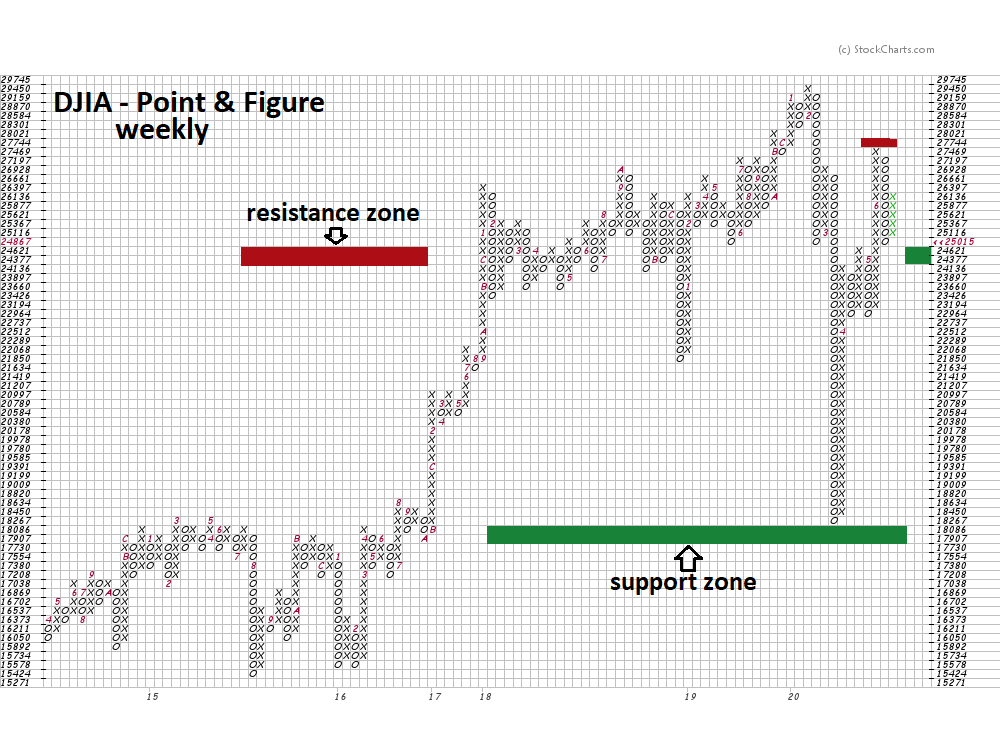
| Point & Figure charts have been utilized for decades and are one of the most reliable methods in discovering market support and resistance. A unique feature of Point & Figure (P & F) charts is that they plot price movements without taking into consideration the passage of time. P & F charts are composed of price unit boxes. For example, a price unit box could be 2 points for an asset priced at 200. When price moves above 202 an "X" is recorded, a price move above 204 registers another "X". This progress continues up the column until upside breakouts stop. When downside breakouts occur, an "O" is recorded in a new column. Dow Jones Industrial Average P & F charts can be used on any time scale, daily and weekly charts can be accessed at stockcharts.com. Please see the weekly Dow Jones Industrial Average (DJIA) P & F chart illustrated in Figure 1. This is an update to the DJIA P & F chart illustrated in my article "Dawn of the Bear Market?". The original chart was made just after the March 20, 2020 close and was chosen because the DJIA was, of the three main US stock indices, closest to P & F support. At the time, the DJIA low was 18917, subsequently the DJIA came down to the upper edge of the support zone. Support/resistance is represented by the longest row or rows of "X's" and "O's", this support zone is just above the longest row. Note the S&P 500 and the Nasdaq Composite did not come near their respective P & F support zones. In a situation with more than one index or asset, analyze the one that is closest to P & F support/resistance. The powerful rally off P & F support has pushed through considerable resistance, stopping just below a much smaller resistance zone. The DJIA ability to push above the larger resistance could be a hint that it could push above the smaller resistance an make a new all-time high. Note that the recent decline has brought the DJIA to just above a small support zone which corresponds with the prior large resistance zone. Perhaps the DJIA has made, or could soon make, an intermediate bottom. |
|
| Figure 1. The powerful rally off P & F support has pushed through considerable resistance. |
| Graphic provided by: StockCharts.com. |
| |
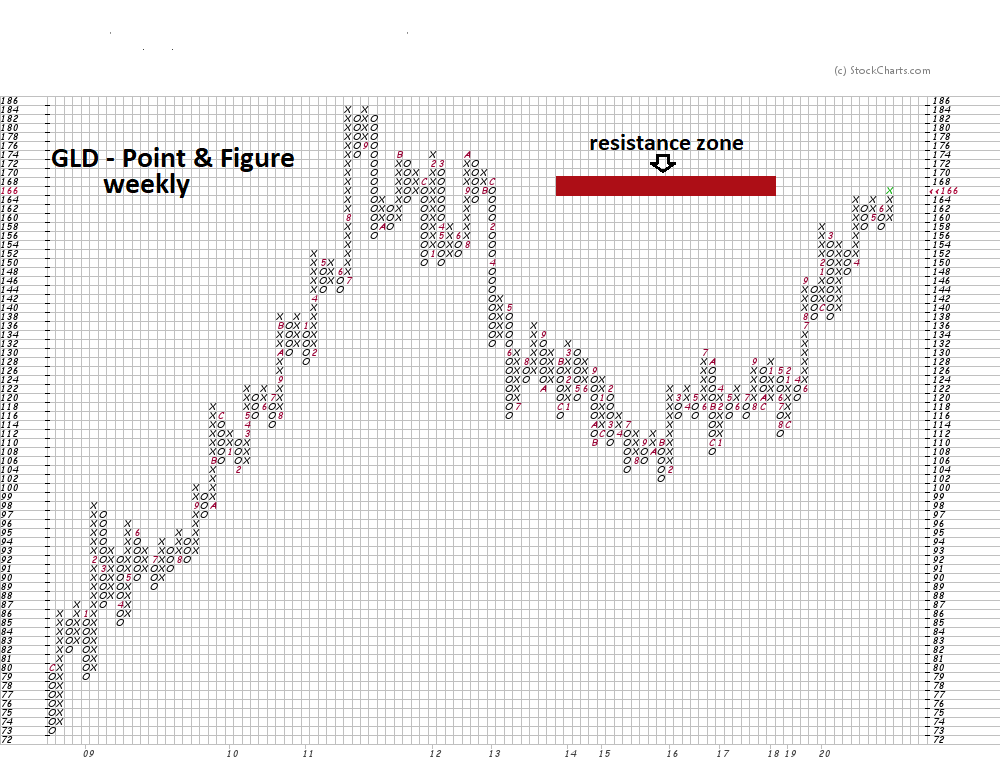
| Gold My March 5, 2020 article "Precious Metal Sell Signals - Part Two" noted that Gold continuous futures (GC1!) may have reached an important top on February 24. Subsequently, on March 9 GC1! made a marginal new high at 1704. Just five trading days later CG1! reached 1450 and it appeared to be the kickoff of a larger bear trend. The bear trend did not materialize. Please see the weekly P & F chart for the Gold Exchange Traded Fund (GLD) illustrated in Figure 2. GLD came down from 158 to 136, in this instance no support signal from P & F, as the mini crash bottom occurred well above a possible support zone. However, as of the week ending June 26, 2020 GLD has pushed into a resistance zone. Late June into early July could be a particularly important time for GLD. If price is rejected from the resistance zone an important top could be in place. A breakthrough of resistance could open the door to a new all-time high. |
|
| Figure 2. As of the week ending June 26, 2020 GLD has pushed into a resistance zone. |
| Graphic provided by: StockCharts.com. |
| |
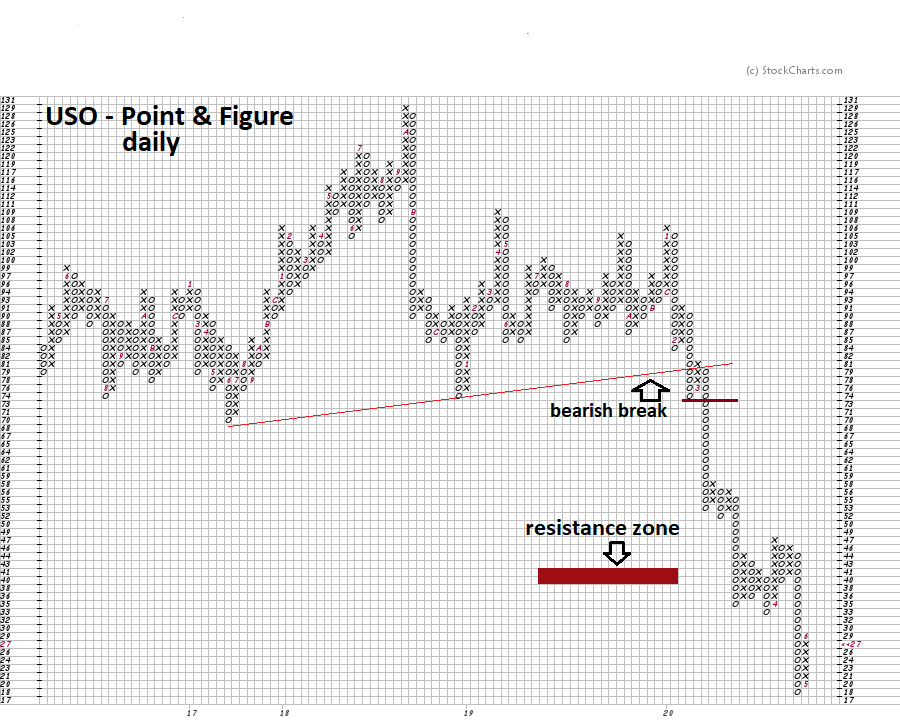
| Crude Oil Please see the daily P & F chart for United States Oil Fund (USO) illustrated in Figure 3. Trendlines on P & F charts can be excellent tools for confirming important trend changes. The break below the rising trendline gave an important hint of something very bearish forming. The subsequent small bounce after the trendline break provided an excellent spot to enter short positions. The break below 73 provided another point in which to short. The rally off the recent bottom is still below potential resistance, implying more upside in the coming weeks. |
|
| Figure 3. The break below the rising trendline gave an important hint of something very bearish forming. |
| Graphic provided by: StockCharts.com. |
| |
| Old Vs. New Traders are always looking to increase profits and reduce losses. We look to see if there are new momentum oscillators, or a new combination of moving averages to improve results. Point & Figure charts have been in use since the early twentieth century, that they are still being utilized is a testament to their effectiveness. Perhaps improvement can come from something old instead of something new. |
Independent investment advisor, trader and writer. He has written articles for Technical Analysis of Stocks & Commodities, Traders.com Advantage,Futuresmag.com and, Finance Magnates. Author of website Four Dimension Trading.
| Website: | www.fourdimensiontrading.com |
| E-mail address: | markrivest@gmail.com |
Click here for more information about our publications!
PRINT THIS ARTICLE

Request Information From Our Sponsors
- VectorVest, Inc.
- Executive Premier Workshop
- One-Day Options Course
- OptionsPro
- Retirement Income Workshop
- Sure-Fire Trading Systems (VectorVest, Inc.)
- Trading as a Business Workshop
- VectorVest 7 EOD
- VectorVest 7 RealTime/IntraDay
- VectorVest AutoTester
- VectorVest Educational Services
- VectorVest OnLine
- VectorVest Options Analyzer
- VectorVest ProGraphics v6.0
- VectorVest ProTrader 7
- VectorVest RealTime Derby Tool
- VectorVest Simulator
- VectorVest Variator
- VectorVest Watchdog
- StockCharts.com, Inc.
- Candle Patterns
- Candlestick Charting Explained
- Intermarket Technical Analysis
- John Murphy on Chart Analysis
- John Murphy's Chart Pattern Recognition
- John Murphy's Market Message
- MurphyExplainsMarketAnalysis-Intermarket Analysis
- MurphyExplainsMarketAnalysis-Visual Analysis
- StockCharts.com
- Technical Analysis of the Financial Markets
- The Visual Investor