

HOT TOPICS LIST
- MACD
- Fibonacci
- RSI
- Gann
- ADXR
- Stochastics
- Volume
- Triangles
- Futures
- Cycles
- Volatility
- ZIGZAG
- MESA
- Retracement
- Aroon
INDICATORS LIST
LIST OF TOPICS
PRINT THIS ARTICLE
by Matt Blackman
As we learn every time there is panic in markets, correlation for most, if not all asset classes, goes to one. But there are a few survivors in the fray. Here is one stock.
Position: N/A
Matt Blackman
Matt Blackman is a full-time technical and financial writer and trader. He produces corporate and financial newsletters, and assists clients in getting published in the mainstream media. Matt has earned the Chartered Market Technician (CMT) designation. Follow Matt on Twitter at www.twitter.com/RatioTrade
PRINT THIS ARTICLE
BULL/BEAR MARKET
Costco - A Solid Stock in a Storm?
03/19/20 12:20:30 PMby Matt Blackman
As we learn every time there is panic in markets, correlation for most, if not all asset classes, goes to one. But there are a few survivors in the fray. Here is one stock.
Position: N/A
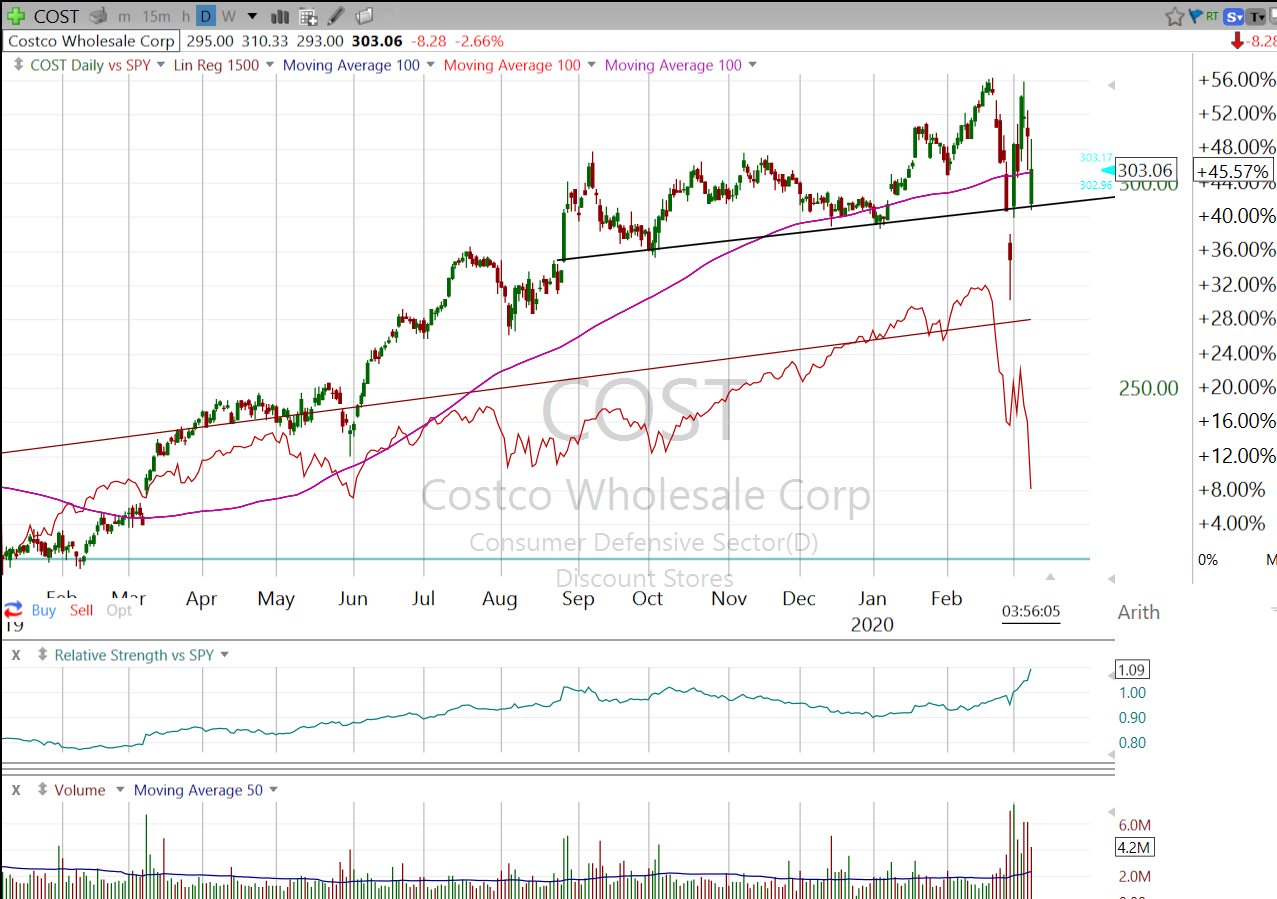
| In corrections, troubles generally come in packs and the meltdown of March 2020 is no exception. There had already been headwinds in the form of a yield curve inversion and stagnant corporate profits but amazingly stocks looked on the cusp of recovery as 2020 arrived. That was until COVID-19 reared its head, followed by a failure for OPEC to agree on oil production cuts in early March and the rout began in earnest. Between February 20 and March 9, the S&P 500 lost nearly 20%, pulling it into bear market territory. Trading on a number of exchanges was briefly halted for the first time since the U.S. election in 2016. |
|
| Figure 1. Daily chart of Costco Wholesale (COST) compared to the S&P 500 Trust ETF (SPY) in red. |
| Graphic provided by: Freestockcharts.com. |
| |
| Technically, COST held up well through early mayhem. After dipping below six-month uptrend support on February 28, it rallied back above it in the face of a $20 per barrel crude oil drop and as I write this, is off less than 7%. One reason may be that Costco has seen customers flock to empty its shelves of toilet paper and other essentials amid corona-virus concerns. Why toilet paper you ask? Good question, but panics are rarely rational! |
|
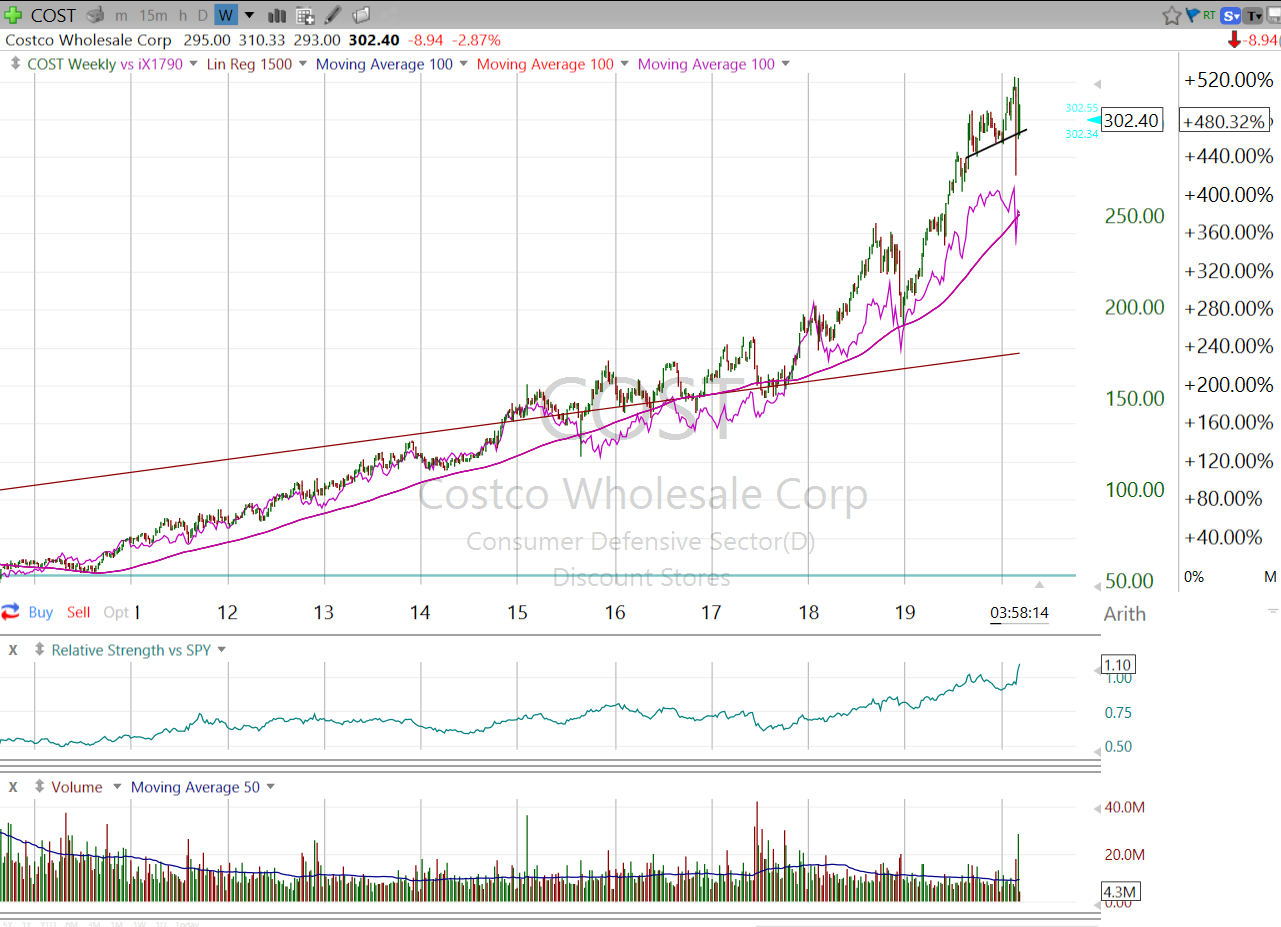
| Figure 2. Weekly chart of COST showing long-term performance since the beginning of the 11-year bull market in March 2009 compared to the Discount Stores industry group (purple). The red line is the 1500 period Linear Regression Line. |
| Graphic provided by: Freestockcharts.com. |
| |
| But whether rational or not, investors still have faith that COST will avoid the worst of the selling. Its balance sheet is another good reason for optimism. With a forward dividend yield of 0.84% and growth in each of its previous four quarters, earnings are up more than 14% in the latest year and dividends boast a five-year growth of 3.94%. If this correction worsens in the coming months, people still need to eat, buy drugs and essentials like toilet paper. And if this recent trend is any indication COST should do better than most stocks. But in any forecast, it's always prudent to have an exit strategy should the unexpected happen. A drop below $300 on above average volume would be a good place for a stop loss. |
| Suggested Reading: Recession Watch - Yield Curve Turns Negative Again Seasons in the Sun - Sourcing New Economy Winners and the Best Times to Trade Them In Search of Fossil-Fuel Free Returns |
Matt Blackman is a full-time technical and financial writer and trader. He produces corporate and financial newsletters, and assists clients in getting published in the mainstream media. Matt has earned the Chartered Market Technician (CMT) designation. Follow Matt on Twitter at www.twitter.com/RatioTrade
| Title: | Author |
| Company: | TradeSystemGuru |
| Address: | Box 2589 |
| Garibaldi Highlands, BC V0N1T0 | |
| Phone # for sales: | 6048989069 |
| E-mail address: | indextradermb@gmail.com |
Traders' Resource Links | |
| TradeSystemGuru has not added any product or service information to TRADERS' RESOURCE. | |
Click here for more information about our publications!
PRINT THIS ARTICLE

Request Information From Our Sponsors
- VectorVest, Inc.
- Executive Premier Workshop
- One-Day Options Course
- OptionsPro
- Retirement Income Workshop
- Sure-Fire Trading Systems (VectorVest, Inc.)
- Trading as a Business Workshop
- VectorVest 7 EOD
- VectorVest 7 RealTime/IntraDay
- VectorVest AutoTester
- VectorVest Educational Services
- VectorVest OnLine
- VectorVest Options Analyzer
- VectorVest ProGraphics v6.0
- VectorVest ProTrader 7
- VectorVest RealTime Derby Tool
- VectorVest Simulator
- VectorVest Variator
- VectorVest Watchdog
- StockCharts.com, Inc.
- Candle Patterns
- Candlestick Charting Explained
- Intermarket Technical Analysis
- John Murphy on Chart Analysis
- John Murphy's Chart Pattern Recognition
- John Murphy's Market Message
- MurphyExplainsMarketAnalysis-Intermarket Analysis
- MurphyExplainsMarketAnalysis-Visual Analysis
- StockCharts.com
- Technical Analysis of the Financial Markets
- The Visual Investor