

HOT TOPICS LIST
- MACD
- Fibonacci
- RSI
- Gann
- ADXR
- Stochastics
- Volume
- Triangles
- Futures
- Cycles
- Volatility
- ZIGZAG
- MESA
- Retracement
- Aroon
INDICATORS LIST
LIST OF TOPICS
PRINT THIS ARTICLE
by Mark Rivest
Can the bear market in US interest rates continue?
Position: N/A
Mark Rivest
Independent investment advisor, trader and writer. He has written articles for Technical Analysis of Stocks & Commodities, Traders.com Advantage,Futuresmag.com and, Finance Magnates. Author of website Four Dimension Trading.
PRINT THIS ARTICLE
CHART ANALYSIS
The Yield Curve
11/07/19 04:40:20 PMby Mark Rivest
Can the bear market in US interest rates continue?
Position: N/A
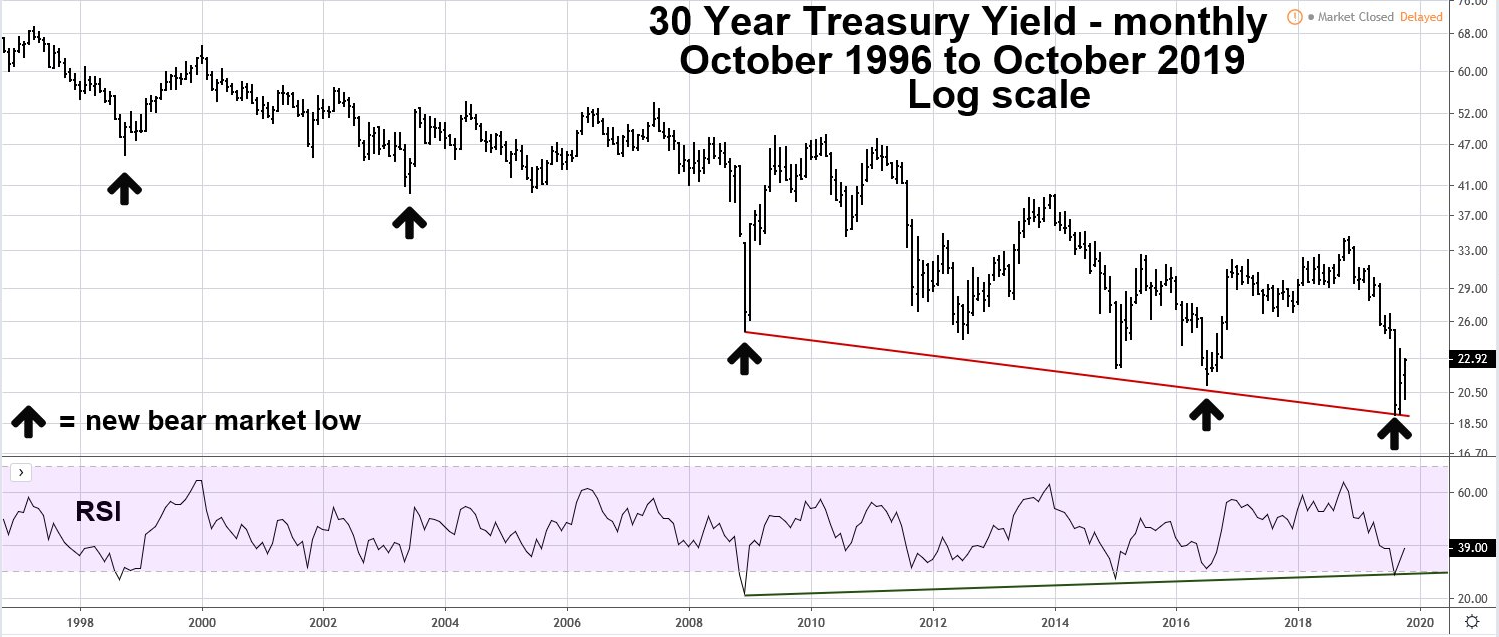
| Since the inception of the United States over two-hundred years ago, the rates/yields of US government debt securities have fluctuated in multi-decade bull and bear markets. Within the last one-hundred years there have been three cycles: 1920 to 1946 declining yields, 1946 to 1981 rising yields, 1981 to 2019 declining yields. In September 2019 the yield on the US government 30-year Treasury bonds (TYX) reached a new bear market low. Is this a signal that yields could continue lower for several more years, or could something else be happening? A study of the yield curve reveals interesting clues. 30-Year Treasury Yield My September 20, 2018 article "Interest Rates Basing for a Breakout?" noted that 30-year Treasury yields (TYX) had formed a multi-year bullish "Cup with Handle" pattern and was just below major multi-year Fibonacci resistance. I speculated a move above TYX resistance at 3.26 could trigger a move up to at least 4.00. This forecast proved to be spectacularly wrong. TYX subsequently did move above 3.26 but the rally only lasted a few weeks and then resumed its multi-decade bear market, making a new low in September 2019. Please see the monthly 30-year Treasury Yield chart (TYX) illustrated in Figure 1. Note that the monthly RSI has a significant bullish divergence vs. the low made at the TYX bottom made in 2008. This indicates weakening of downside momentum. Also note the declining trend line connecting the 2008 and 2016 bottoms. On the Log scale chart, TYX marginally broke below the line, while on an Arithmetic scale chart the 2019 bottom hits exactly on the line. |
|
| Figure 1. Note that the monthly RSI has a significant bullish divergence vs. the low made at the TYX bottom made in 2008. |
| Graphic provided by: TradingView. |
| |
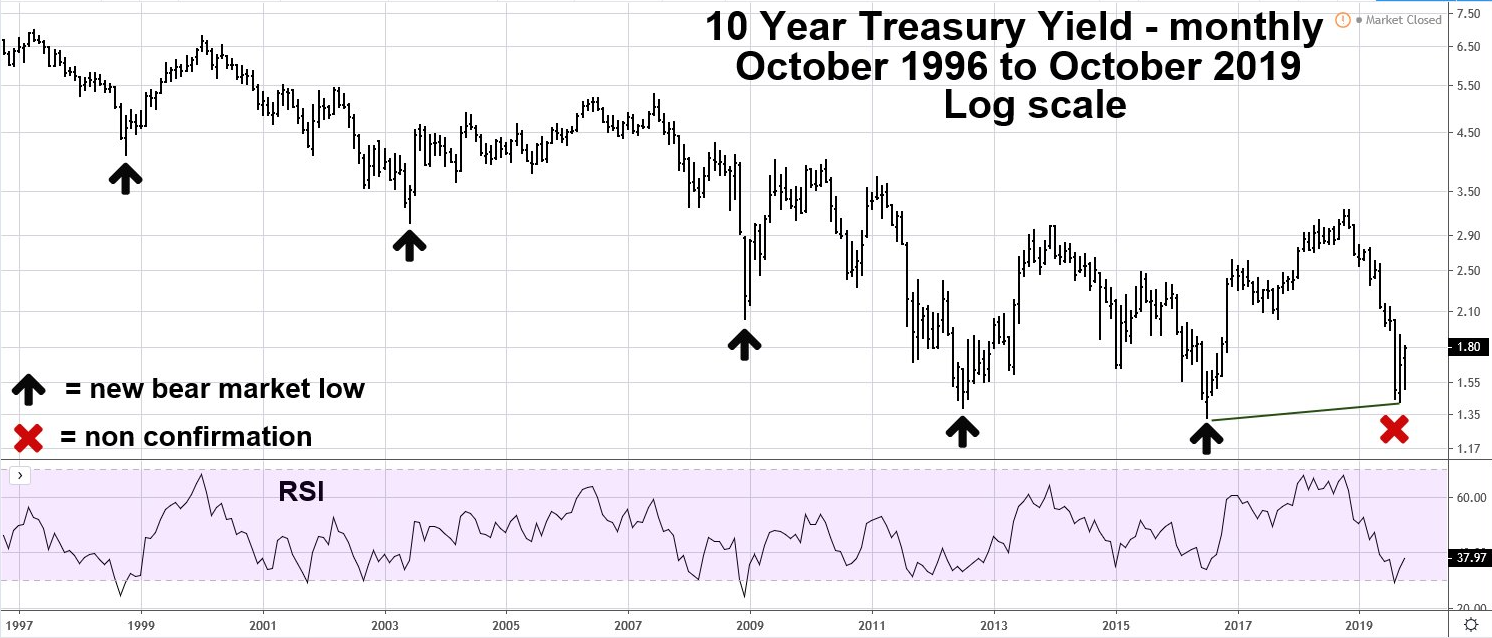
| 10-Year Treasury Yield During the early part of the Twentieth century, "Dow Theory" introduced the concept of divergences between stock indices. At that time only two indexes were examined, the Dow Industrials and the Dow Rails (now called Dow Transports). The Industrials making a new bull market high unconfirmed by the Rails was a signal of an approaching bear market. The reverse would be the case in an unconfirmed bear market bottom. The concept applies today, except now there are many more stock market indices to make comparisons. The key point to remember is that in a healthy stock bull/bear market most or all sectors should be confirming bull/bear market highs/lows. The same is true for interest rates/yields; in a long-term bull/bear market all segments of the yield curve from the shortest term to the longest should confirm the trend. The monthly 10-year Treasury Yield chart (TNX) illustrated in Figure 2 shows the bulk of the bear market since 1981. Note that for the first time something different is happening. The 10-year yield has so far not confirmed the bear market bottom made in the 30-year yield. An examination further down the yield curve gives us more clues. |
|
| Figure 2. The 10-year yield has so far not confirmed the bear market bottom made in the 30�year yield. |
| Graphic provided by: TradingView. |
| |
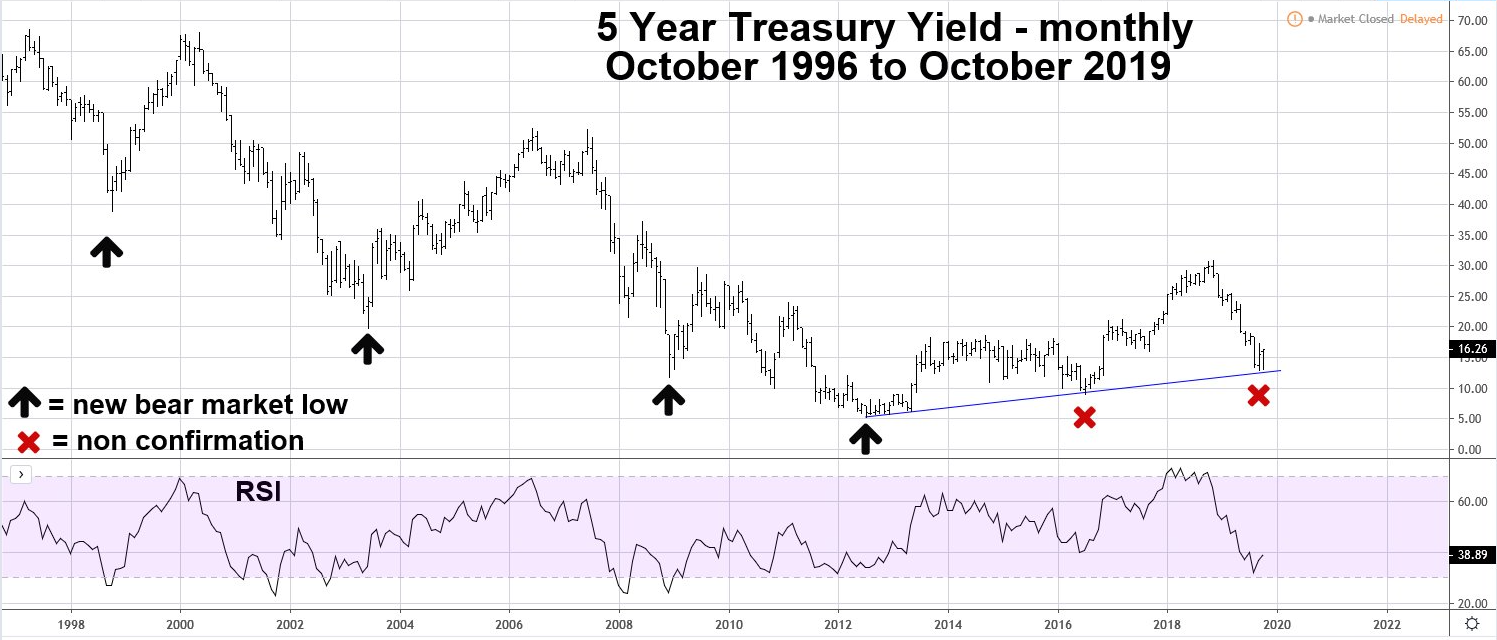
| 5-Year Treasury Yield R.N Elliott, discoverer of the wave theory now named after him, recommended using both Arithmetic and Log scale charts to help determine wave counts. Examination of both scales goes beyond the scope of wave counting. As noted about the 30-year yield, the September 2019 bottom hits right on a multi-year trend line. The monthly 5-year Treasury Yield chart (FVX) illustrated in Figure 3 uses Arithmetic scale. Note that the recent low in September 2019 comes very close to hitting the multi-year trend line that began in 2012. FVX also has two bullish divergences vs. the TYX. Five-year yield now fits the classic definition of a bull market — a series of rising highs and rising lows. |
|
| Figure 3. The recent low in September 2019 comes very close to hitting the multi�year trend line that began in 2012. |
| Graphic provided by: TradingView. |
| |
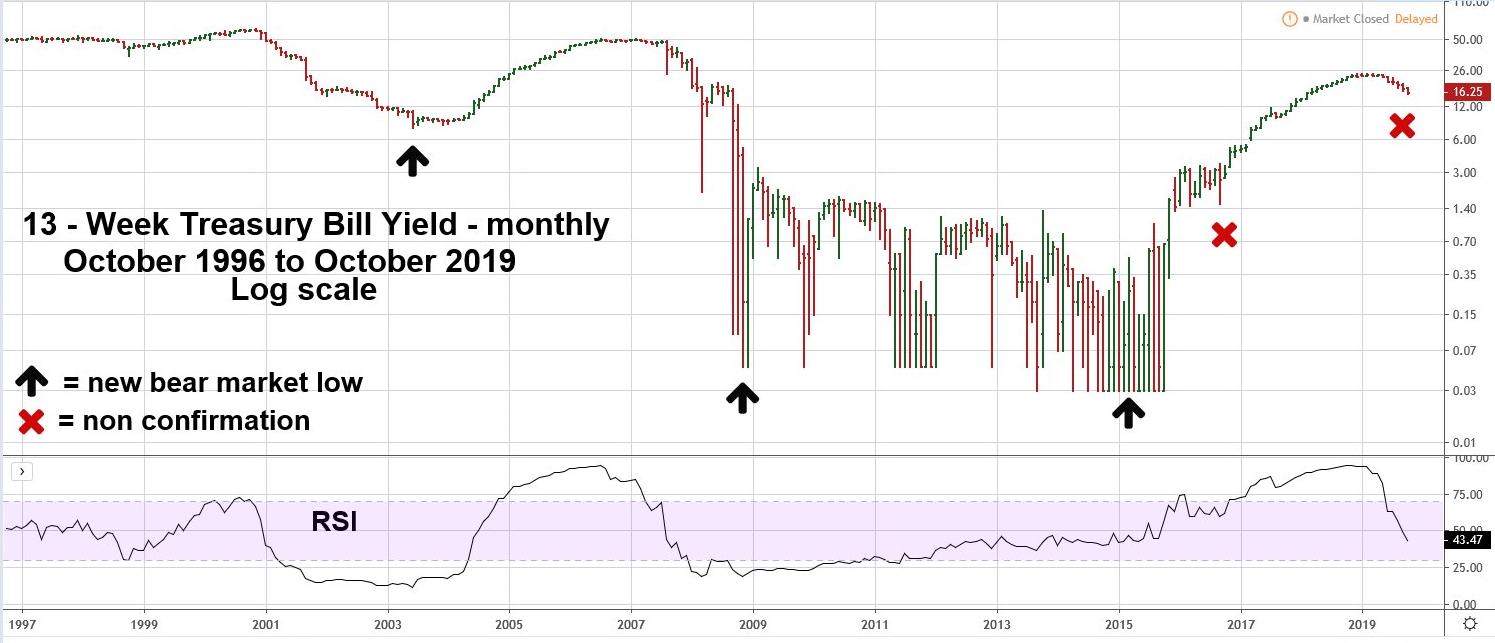
| 13-Week Treasury Bill Yield Please see the monthly 13-week Treasury Bill chart (IRX) illustrated in Figure 4. Short term rates/yields are the area of the yield curve the FOMC has the most influence. Typically, the FOMC is following the trend already in place — they don't initiate change. The most recent example of this happened in March 2019. IRX hit a high then started trending down. It wasn't until July that the FOMC lowered rates. IRX has two bullish divergence vs. TYX and the current divergence is massive. It would take a lot of FOMC easing to bring IRX back down to the bottom last seen in 2015. |
|
| Figure 4. IRX has two bullish divergence vs. TYX and the current divergence is massive. |
| Graphic provided by: TradingView. |
| |
| Conclusion My November 22, 2017 article "The Long Turn" noted that the TYX could be forming a base like the Gold Market base from 1999 to 2001. It's possible the TYX bottom made in September 2019 is the final part of a base that began in 2016. On October 30, 2019 the FOMC is expected to make another rate cut. Watch the reaction of TYX to see what happens after the announcement. If TYX fails to make a new bear market low in the next few weeks, it could be another important clue. It's possible the entire US debt yield curve is in the early phase of a multi-decade bull market. Further Reading: Frost A.J and Robert Prechter (1985) "Elliott Wave Principle", New Classics Library. O'Neil J. William (2009) "How to Make Money in Stocks", McGraw-Hill |
Independent investment advisor, trader and writer. He has written articles for Technical Analysis of Stocks & Commodities, Traders.com Advantage,Futuresmag.com and, Finance Magnates. Author of website Four Dimension Trading.
| Website: | www.fourdimensiontrading.com |
| E-mail address: | markrivest@gmail.com |
Click here for more information about our publications!
Comments

Request Information From Our Sponsors
- StockCharts.com, Inc.
- Candle Patterns
- Candlestick Charting Explained
- Intermarket Technical Analysis
- John Murphy on Chart Analysis
- John Murphy's Chart Pattern Recognition
- John Murphy's Market Message
- MurphyExplainsMarketAnalysis-Intermarket Analysis
- MurphyExplainsMarketAnalysis-Visual Analysis
- StockCharts.com
- Technical Analysis of the Financial Markets
- The Visual Investor
- VectorVest, Inc.
- Executive Premier Workshop
- One-Day Options Course
- OptionsPro
- Retirement Income Workshop
- Sure-Fire Trading Systems (VectorVest, Inc.)
- Trading as a Business Workshop
- VectorVest 7 EOD
- VectorVest 7 RealTime/IntraDay
- VectorVest AutoTester
- VectorVest Educational Services
- VectorVest OnLine
- VectorVest Options Analyzer
- VectorVest ProGraphics v6.0
- VectorVest ProTrader 7
- VectorVest RealTime Derby Tool
- VectorVest Simulator
- VectorVest Variator
- VectorVest Watchdog