HOT TOPICS LIST
- MACD
- Fibonacci
- RSI
- Gann
- ADXR
- Stochastics
- Volume
- Triangles
- Futures
- Cycles
- Volatility
- ZIGZAG
- MESA
- Retracement
- Aroon
INDICATORS LIST
LIST OF TOPICS
PRINT THIS ARTICLE
by Mark Rivest
See where the next big interest rate rise could begin.
Position: N/A
Mark Rivest
Independent investment advisor, trader and writer. He has written articles for Technical Analysis of Stocks & Commodities, Traders.com Advantage,Futuresmag.com and, Finance Magnates. Author of website Four Dimension Trading.
PRINT THIS ARTICLE
CHART ANALYSIS
Interest Rates Basing for a Breakout?
09/20/18 03:04:23 PMby Mark Rivest
See where the next big interest rate rise could begin.
Position: N/A
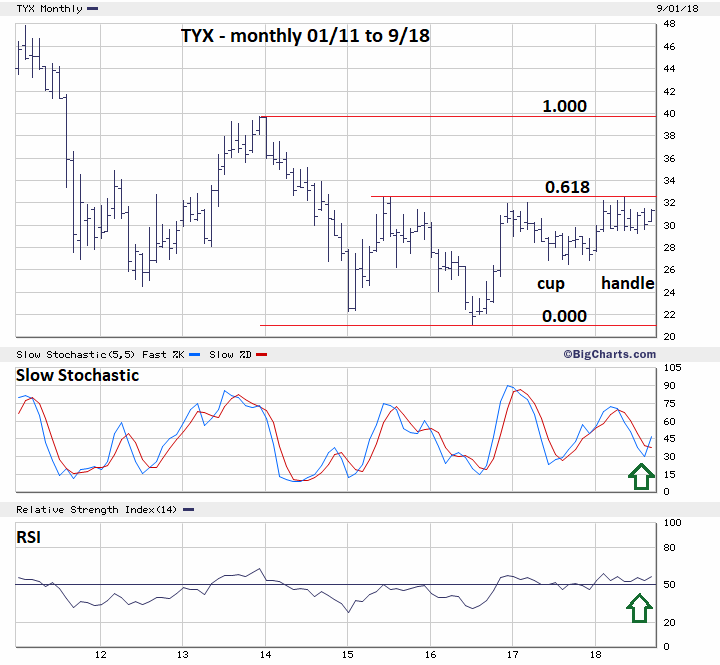
| For nearly two years the CBOE 30-Year Treasury Yield (TYX) has been trading in a bracket between 2.70 and 3.20. Has the TYX formed a double top or basing for the next bull phase? Elements from the dimensions of price and momentum provide enticing clues that the direction for interest rates is up. 30-Year US Treasury Yield/Rate My November 22, 2017, article "The Long Turn" noted that the TYX could be forming a base like the Gold market base from 1999 to 2001 and that the next TYX basing low could come in January 2018. So far, the September 2017 TYX bottom at 2.65 has held. A successful test of this bottom was made in December at 2.69. The subsequent rally topped in May at 3.25. Please see the TYX monthly chart illustrated in Figure 1. The May 2018 high is fascinating for two reasons. One: It nearly matches the June 2015 peak at 3.26. Two: A .618 retrace of the December 2013 top to the July 2016 bottom of 2.10 is also 3.26. These concurrent points are potentially powerful resistance which would require a powerful force to break through. Additionally, the movement from the December 2016 top is a perfect "Cup with Handle" pattern — developed by William O'Neil. A subsequent breakout from the handle's trading range signals a continuation of the prior advance. The momentum dimension has the Slow Stochastic showing a bullish crossover signal. The RSI is holding above the 50% threshold and is nowhere near the overbought zone. |

|
| Figure 1. The movement from the December 2016 top is a perfect "Cup with Handle" pattern. |
| Graphic provided by: BigCharts.com. |
| |
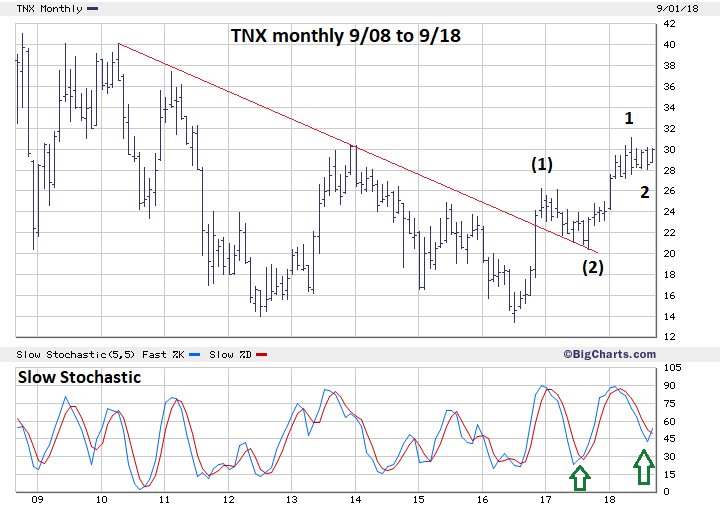
| 10-Year US Treasury Yield/Rate The CBOE 10-Year Treasury Yield (TNX) also has evidence that interest rates could continue to climb. Please see the TNX monthly chart illustrated in Figure 2. In late 2016 TNX broke decisively above a declining trend line that began in 2010. Also note that the subsequent decline was held in check by the declining line. The price pattern from the TNX low of 13.36 made in July of 2016 appears to be an Elliott wave series of "ones and twos". If so, a subsequent move above the TNX May peak at 31.15 could be a third of a third wave. This is usually the longest and most powerful segment of an Elliott impulse wave. Also note the recent Slow Stochastic bullish crossover. After the bullish crossover made in 2017, the TNX rallied 10.81 points. If you add 10.81 points to the TNX August bottom at 28.08, it targets TNX 38.89. If a third of a third wave is in effect this target could be greatly exceeded. |

|
| Figure 2. In late 2016 TNX broke decisively above a declining trend line that began in 2010. |
| Graphic provided by: BigCharts.com. |
| |
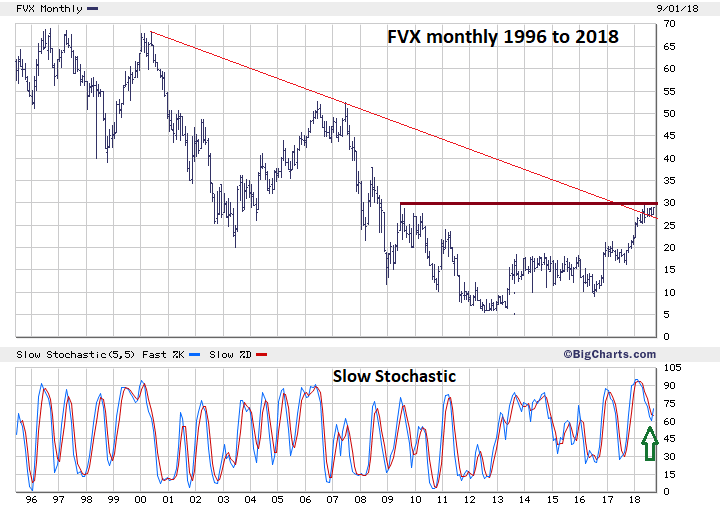
| 5-Year US Treasury Yield/Rate The CBOE 5-Year Treasury Yield (FVX) chart illustrated in Figure 3 shows a break above a declining trend line from the year 2000. The breakout so far has been marginal because it's also around the next major resistance. The June 2009 peak is at 29.91. A .382 retrace from the 1996 high to the 2012 low is at 29.66. The May 2018 high is at 29.41. The 29.91 point is where the next bullish break out could come. Note that the FVX Slow Stochastic has also had a recent bullish crossover. However, this signal is coming just above the 60% Slow Stochastic level. This signal is higher than the crossovers for TYX and TNX and implies the 5-year yield could rise less relative to the 10- and 30-year yields. |

|
| Figure 3. The 29.91 point is where the next bullish break out could come. |
| Graphic provided by: BigCharts.com. |
| |
| US Stock Market and Interest Rates Money gravitates to where it's treated best. Since the US stock bull market began in 2009 most of its rise has been in a declining interest rate environment. And the rates were at or near the lowest in US history — very weak competition for stocks. It wasn't until 2016 when the 5-, 10-, and 30-year rates began rising together. As of mid-September 2018 the major US stock indices are only slightly below their all-time highs. Apparently, interest rates are not yet at a level to draw money away from stocks, but that could change if rates have another rally. Another factor that could be bearish for US stocks is a weakening Chinese economy. My July 12 article "Trade War - US Vs. China" noted that the Shanghai Composite (SHCOMP) was the weakest of the major world indices. This weakness predates the current trade war between the US and China and is the best indicator/forecaster of the Chinese economy. On September 12, 2018, SHCOMP reached 2647.17, just above major support at 2638.30 made back in January 2016. In the next several weeks there are two important levels that need to be watched. The first is TYX, a break above 3.26 could strongly imply that a move up to at least 4.00 could be underway. The second is SHCOMP, a break below 2638.30 could strongly imply a move down to at least 2000. China is the worlds second largest economy, if its stock market continues to decline it could be forecasting more economic weakness that could spread globally. Economic weakness combined with rising interest rates could trigger at least a multi-month decline for the US and global stock markets. The message from technical analysis indicates that interest rates could rise while the economy weakens. This sounds like a contradiction, but you must be prepared for the possibility. If it does happen, I guess that economists will have reasons for its occurrence — after it's too late to act. Further Reading: O'Neil J. William (2009) "How to Make Money in Stocks", McGraw-Hill Frost A.J and Robert Prechter (1985) "Elliott Wave Principle", New Classics Library. |
Independent investment advisor, trader and writer. He has written articles for Technical Analysis of Stocks & Commodities, Traders.com Advantage,Futuresmag.com and, Finance Magnates. Author of website Four Dimension Trading.
| Website: | www.fourdimensiontrading.com |
| E-mail address: | markrivest@gmail.com |
Click here for more information about our publications!
Comments

Request Information From Our Sponsors
- StockCharts.com, Inc.
- Candle Patterns
- Candlestick Charting Explained
- Intermarket Technical Analysis
- John Murphy on Chart Analysis
- John Murphy's Chart Pattern Recognition
- John Murphy's Market Message
- MurphyExplainsMarketAnalysis-Intermarket Analysis
- MurphyExplainsMarketAnalysis-Visual Analysis
- StockCharts.com
- Technical Analysis of the Financial Markets
- The Visual Investor
- VectorVest, Inc.
- Executive Premier Workshop
- One-Day Options Course
- OptionsPro
- Retirement Income Workshop
- Sure-Fire Trading Systems (VectorVest, Inc.)
- Trading as a Business Workshop
- VectorVest 7 EOD
- VectorVest 7 RealTime/IntraDay
- VectorVest AutoTester
- VectorVest Educational Services
- VectorVest OnLine
- VectorVest Options Analyzer
- VectorVest ProGraphics v6.0
- VectorVest ProTrader 7
- VectorVest RealTime Derby Tool
- VectorVest Simulator
- VectorVest Variator
- VectorVest Watchdog
