HOT TOPICS LIST
- MACD
- Fibonacci
- RSI
- Gann
- ADXR
- Stochastics
- Volume
- Triangles
- Futures
- Cycles
- Volatility
- ZIGZAG
- MESA
- Retracement
- Aroon
INDICATORS LIST
LIST OF TOPICS
PRINT THIS ARTICLE
by Mark Rivest
See how the Gold bear market of 1980-1999 could provide clues to the direction of the US Bond market in 2018.
Position: N/A
Mark Rivest
Independent investment advisor, trader and writer. He has written articles for Technical Analysis of Stocks & Commodities, Traders.com Advantage,Futuresmag.com and, Finance Magnates. Author of website Four Dimension Trading.
PRINT THIS ARTICLE
CHART ANALYSIS
The Long Turn
11/22/17 03:49:58 PMby Mark Rivest
See how the Gold bear market of 1980-1999 could provide clues to the direction of the US Bond market in 2018.
Position: N/A
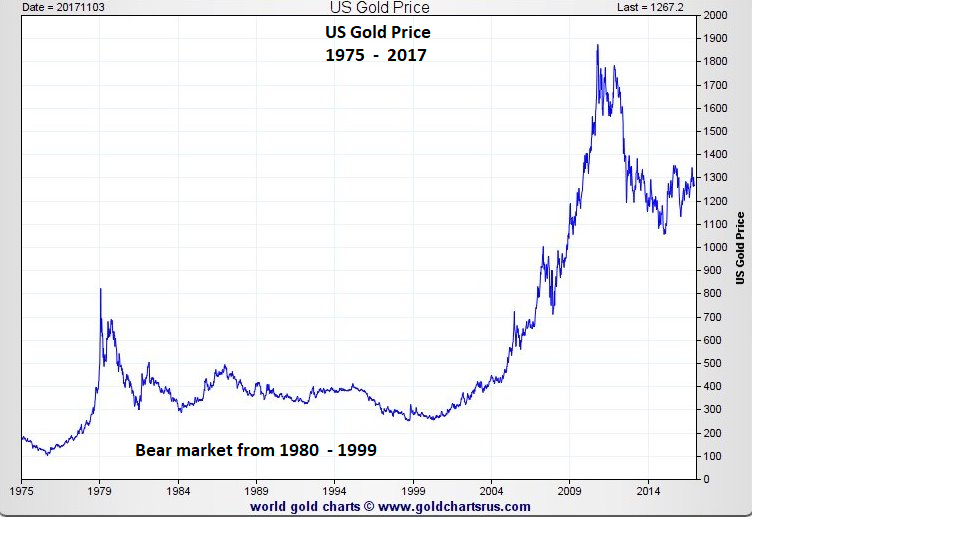
| Changing the direction of a market that's been in a multi-year trend usually takes a transition period that corresponds to amount of time within the trend. The change doesn't come quick. Think of a very large cruise ship or oil tanker, these massive vehicles require a long turn to change direction. A study of the what happened after the 1980-1999 bear market in Gold hints at what may happen for the US Bond market for 2018. Gold - The Big Picture Please see the US Gold Price 1975-2017 chart in Figure 1. The colossal nineteen-year bear ended in the week of August 23, 1999 at 252.10. This was followed by a sharp spike up and then another decline that lasted sixteen months. The next significant bottom came in the week of February 12, 2001 at 254.10. Golds double bottom was just part of the long turn. |

|
| Figure 1. Gold's double bottom was just part of the long turn. |
| Graphic provided by: goldchartsrus.com. |
| |
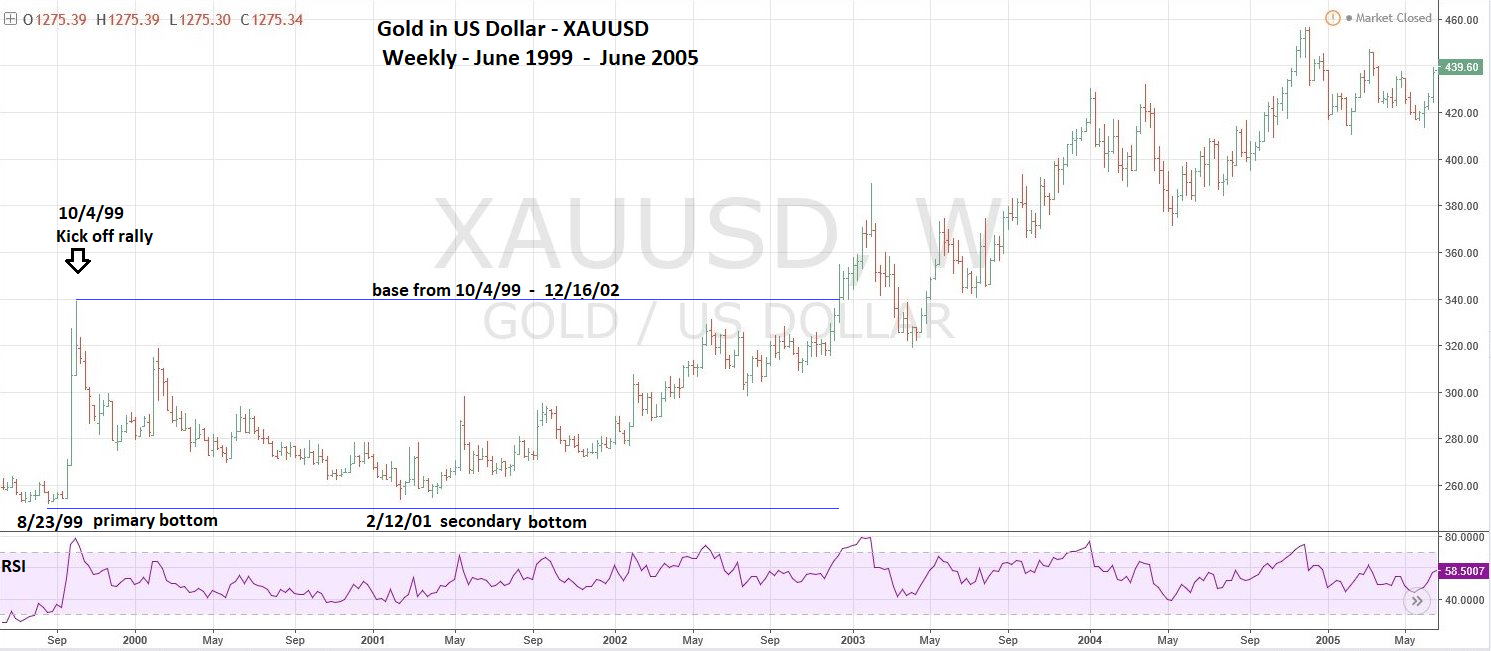
| Gold Base Please see the weekly Gold In US Dollar June 1999-June 2005 chart in Figure 2. After a prolonged bear market the next bull market usually starts off with a bang, called a kick off rally. Weekly RSI typically will reach the overbought zone, in this case near 80%. When a kick off rally occurs most of the crowd believes the bear market is still in effect and use the rally to sell long positions — some of which they've been holding at a loss for years. It's very common for kick off rallies to have retracements between 61-99%. Gold retraced 99% of its kick off rally and this was only about half of the basing period for the next bull market. The next phase of gold's base from February 2001-December 2002 was a very different rally from the initial kick off. The rally that began in February 2001 was gradual and punctuated with minor corrections, each higher than the previous correction. While traders and investors may have suspected the gold bear market concluded with a double bottom, it was not until December 2002 that the bear could be proclaimed dead. During the week of December 16, 2002 gold moved decisively above the kick off rally high at 339.00. This was the first time since the bear market start in 1980 that gold was able to move above a prior significant peak. On a break out of this magnitude you could have entered long on the high tick just above 339.00. Usually for the short term, this type of trade has a high probability of being profitable. The reason — the break through is easy to recognize by all players and they'll follow through with additional buying. Defensive strategies need to be adjusted on this type of trade because sometimes after the initial breakthrough there could be a subsequent correction. Which in this case gold rallied seven weeks and reached 389.00. The subsequent correction went below 339.00. Use smaller positions or be prepared to trade more rapidly than usually when buying the high tick. |

|
| Figure 2. After a prolonged bear market the next bull market usually starts off with a bang, called a kick off rally. |
| Graphic provided by: tradingview.com. |
| |
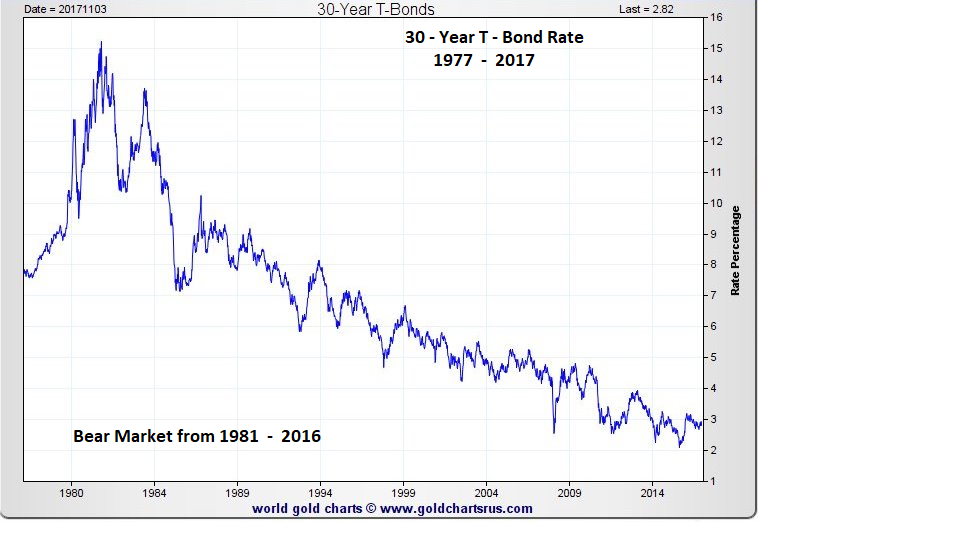
| 30-Year T-Bond rate - The Big Picture Please see the 30-Year T-Bond Rate 1977-2017 chart illustrated in Figure 3. Note: This chart refers to bond rate and the next chart (Figure 4) uses the term bond yield. Most of the time rate and yield have different meanings. For purposes of this article consider rate and yield synonymous. This chart shows bond rates in an enormous bear market since 1981, inversely bond price has been in an enormous bull market. The last significant rate peak was made in the week of December 30, 2013 at 3.90. Until 3.90 is exceeded bond rates could still be in a bear market. |

|
| Figure 3. Until 3.90 is exceeded bond rates could still be in a bear market. |
| Graphic provided by: goldchartsrus.com. |
| |
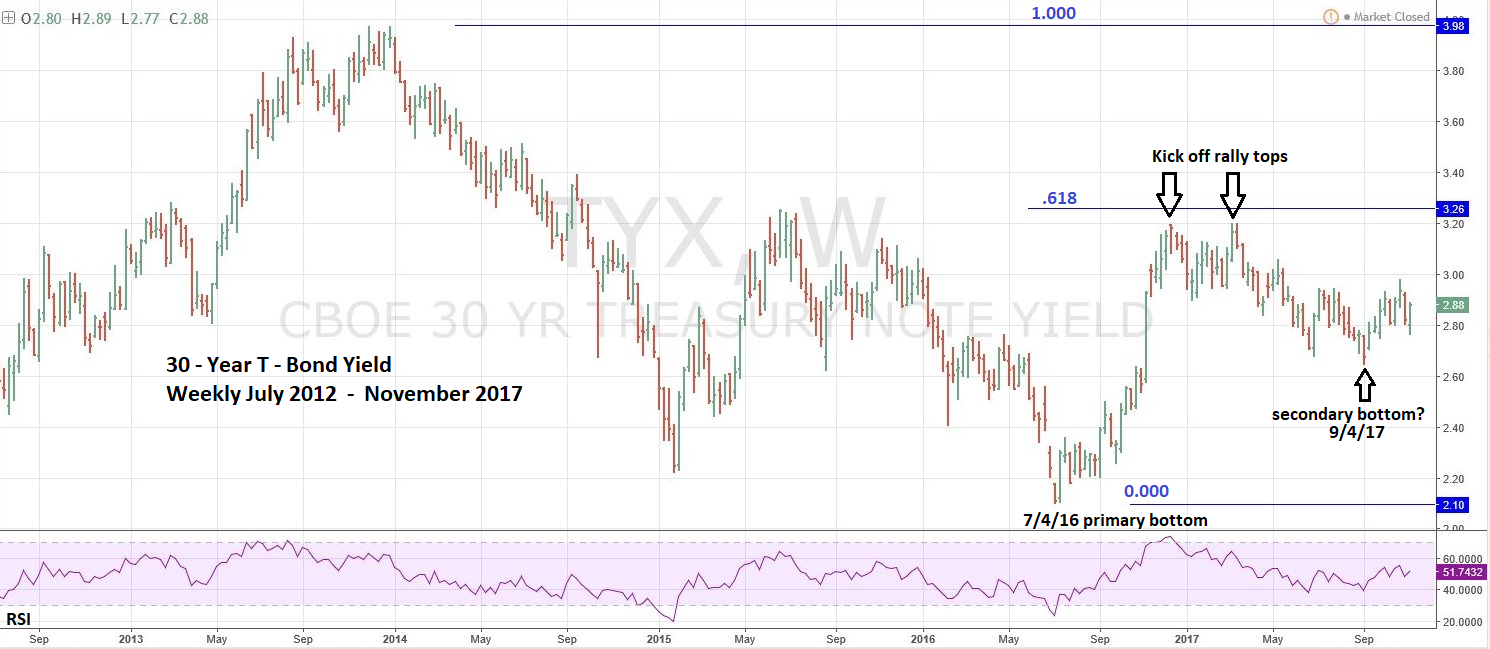
| Bond Yield Base? Please see the weekly 30-Year T-Bond Yield (TYX) chart July 2012-November 2017 in Figure 4. The move up off the all-time low yield of 2.10 made in the week of July 4, 2016 has the characteristics of a kick off rally. Weekly RSI reached the overbought zone at 73% and made a double top at 3.10 in the week of March 13, 2017. Please see my March 22 article "Bond Yield Decision Point". In this article I noted in the summary section, that the weight of evidence from the T-Bond Futures and TYX pointed to declining yields for the next several weeks. This time forecast was off by a wide margin as yield fell for several months bottoming at 2.65 on the week of September 4, 2017. The bottom at 2.65 is an exact 50% retracement of the rally from 2.10 to 3.20. There is no other Fibonacci coordinate near 2.65. Usually a solo 50% coordinate doesn't hold, and a market will gravitate to the more powerful Fibonacci coordinate of .618. Also, since there is still not definitive proof the bear market in yield/bull market in prices is complete, players may still be inclined to buy bonds pushing yields lower. If yields continue lower there could be support at 2.52 which is a .618 retrace of the supposed kick off rally. Time is another factor in the prospect of yields continuing to decline. It's fourteen months from the TYX all-time low to the secondary bottom in September 2017. It was eighteen months between gold's major bottom in 1999 to the secondary 2001 bottom. If yield is still in a post kick off decline, to match the gold decline, a yield bottom could come in January 2018. |

|
| Figure 4. If yields continue lower there could be support at 2.52 which is a .618 retrace of the supposed kick off rally. |
| Graphic provided by: tradingview.com. |
| |
| Summary and Stock Market Update Within the next few months there's a good chance TYX could decline to 2.52. January 2018 could be a secondary TYX bottom. If not, the bond yield bear market was nearly twice the size of the gold bear, it's possible the bond base could be double the gold base. As for stocks, the S&P 500 (SPX) peaked on November 7, which is some Fibonacci 55 trading days from the August 21 bottom. It's almost 1 year since the last significant bottom made on November 4, 2016. Also, the SPX Fibonacci daily time ratio, noted in my last article "Psychological Signposts" has changed from 163/264 = .618 to 175/264 = .661 or 2/3. Three-time cycles pointing to November 7 as a turn day imply an important top could be in place. A move above the November 7 high opens the door for the rally to continue into April 2018. November is usually the most bullish month of the year for US stocks. Even if a top is in place there may not be much of a move down. However, if the SPX can close only marginally down from the open of November, it could be a very important subtle clue that a bear market is underway. More about this in a future article if necessary. Short 25% stocks if the SPX breaks below 2544.00 and use the SPX all-time high as a stop loss. |
Independent investment advisor, trader and writer. He has written articles for Technical Analysis of Stocks & Commodities, Traders.com Advantage,Futuresmag.com and, Finance Magnates. Author of website Four Dimension Trading.
| Website: | www.fourdimensiontrading.com |
| E-mail address: | markrivest@gmail.com |
Click here for more information about our publications!
PRINT THIS ARTICLE

|

Request Information From Our Sponsors
- StockCharts.com, Inc.
- Candle Patterns
- Candlestick Charting Explained
- Intermarket Technical Analysis
- John Murphy on Chart Analysis
- John Murphy's Chart Pattern Recognition
- John Murphy's Market Message
- MurphyExplainsMarketAnalysis-Intermarket Analysis
- MurphyExplainsMarketAnalysis-Visual Analysis
- StockCharts.com
- Technical Analysis of the Financial Markets
- The Visual Investor
- VectorVest, Inc.
- Executive Premier Workshop
- One-Day Options Course
- OptionsPro
- Retirement Income Workshop
- Sure-Fire Trading Systems (VectorVest, Inc.)
- Trading as a Business Workshop
- VectorVest 7 EOD
- VectorVest 7 RealTime/IntraDay
- VectorVest AutoTester
- VectorVest Educational Services
- VectorVest OnLine
- VectorVest Options Analyzer
- VectorVest ProGraphics v6.0
- VectorVest ProTrader 7
- VectorVest RealTime Derby Tool
- VectorVest Simulator
- VectorVest Variator
- VectorVest Watchdog
