HOT TOPICS LIST
- MACD
- Fibonacci
- RSI
- Gann
- ADXR
- Stochastics
- Volume
- Triangles
- Futures
- Cycles
- Volatility
- ZIGZAG
- MESA
- Retracement
- Aroon
INDICATORS LIST
LIST OF TOPICS
PRINT THIS ARTICLE
by Mark Rivest
How to determine when a market crowd has reach an emotional extreme.
Position: N/A
Mark Rivest
Independent investment advisor, trader and writer. He has written articles for Technical Analysis of Stocks & Commodities, Traders.com Advantage,Futuresmag.com and, Finance Magnates. Author of website Four Dimension Trading.
PRINT THIS ARTICLE
MARKET TIMING
Psychological Signposts
11/10/17 11:20:56 AMby Mark Rivest
How to determine when a market crowd has reach an emotional extreme.
Position: N/A
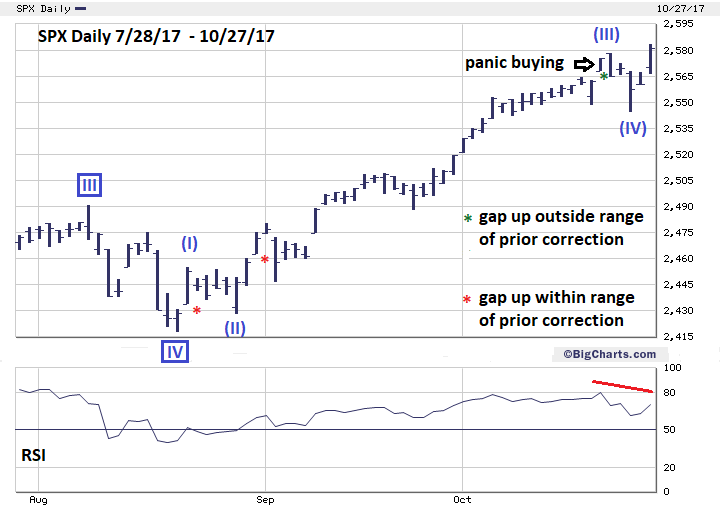
| On rare occasions, every market will exhibit signs that an emotional extreme has been reached and a significant turn is imminent. Psychological signposts are unusual contrary indicators, that when spotted by the wary trader can reap tremendous profits. A classic psychological signpost occurred in the late 1990's when precious metal mutual funds closed due to lack of demand — after a nearly twenty year precious metals bear market. Recently, subtle signposts have appeared in the US stock market that could reap an enormous harvest of profits. Signpost #1 On October 20, 2017 the S&P 500 (SPX) did something that has only happened three times since the latest phase of the bull market began on February 11, 2016. The SPX gapped up outside the range of the last correction and did not subsequently fill the gap later in the day. Please see the daily SPX chart 7/28/17 - 10/27/17 illustrated in Figure 1. The three times this phenomenon occurred were: 1/25/17, 3/1/17, and 10/20/17. The 1/25/17 gap up was only marginally above the prior correction. This was a very minor top and led to a very minor decline. Out of the 427 trading days since February 11, 2016 only March 1 and October 20 gapped significantly outside the prior range; the ratio is .004. It takes a lot of raw emotion to trigger this type of huge and rare move up — a buying panic. After March 1 the SPX declined 3.7% until March 27. The October 20 signal is probably heralding at least a one-month decline. But wait, the SPX made another marginal new high on October 27, 2017. Does this invalidate the October 20 signal? No, please examine a daily chart of the Technology Select Sector SPDR ETF (XLK). Late October is earnings season and on October 27 several large tech companies reported earnings, triggering a gigantic gap up for this ETF. There's an extremely high probability that XLK will begin a serious decline possibly as soon as October 30 and drag the broader US stock market down. |

|
| Figure 1. Out of the 427 trading days since February 11, 2016 only March 1 and October 20 gapped significantly outside the prior range. The ratio is .004. |
| Graphic provided by: BigCharts.com. |
| |
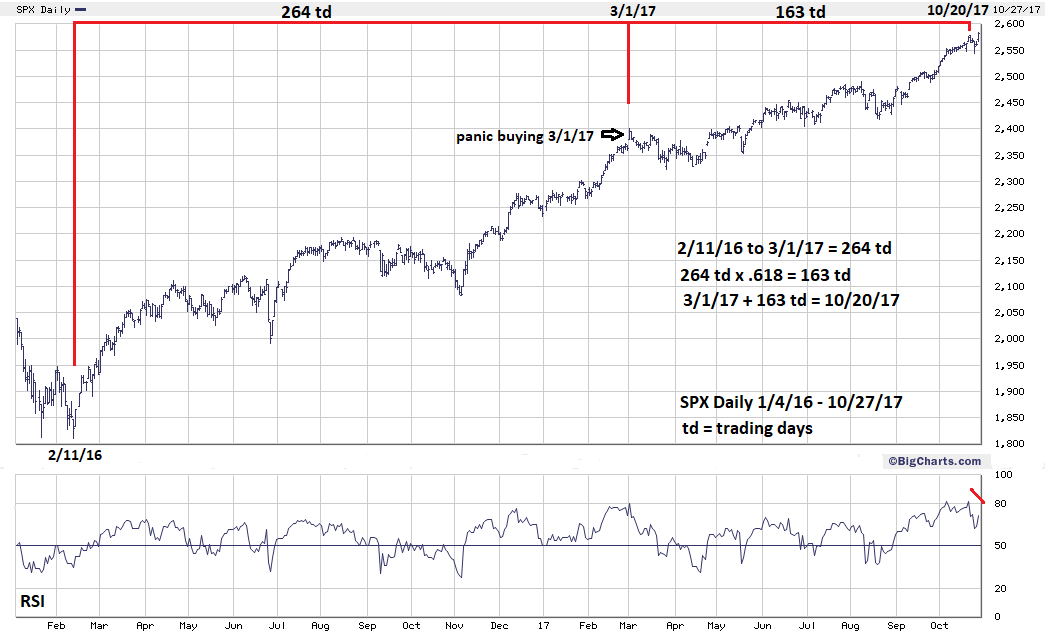
| Signpost #2 Please see the daily SPX chart 1/4/16 - 10/27/17 illustrated in Figure 2. The dual buying panic days of March 1 and October 20 also appear to have formed a rare Fibonacci Golden Section spanning the length of the entire bull phase since February 11, 2016. On a section of this degree — twenty months — you should allow for leeway of plus or minus ten trading days from the bulls-eye date of October 20 for a turn. The Golden Section from February 2016 is another sign of a potential mass crowd emotional extreme. If correct it implies a decline in proportion to the preceding bull phase of at least 15- 20% lasting several months. This potential twenty-month Golden Section may also be related to another much larger Golden Section. Please see my April 12, 2017 article "Termination Date" which illustrated a potential decades long Golden Section that connected the major Dow Jones Industrial Average peaks made in 1937 and 1987. This section targets 2017 as a possible year for the next major stock market top. My October 12, 2017 article "Comparing October 2007 to October 2017" noted a Fibonacci relationship between the SPX May 2011 peak and the May 2015 top that targeted October 2017 as a potential turn. |

|
| Figure 2. The dual buying panic days of March 1 and October 20 also appear to have formed a rare Fibonacci Golden Section spanning the length of the entire bull phase since February 11, 2016. |
| Graphic provided by: BigCharts.com. |
| |
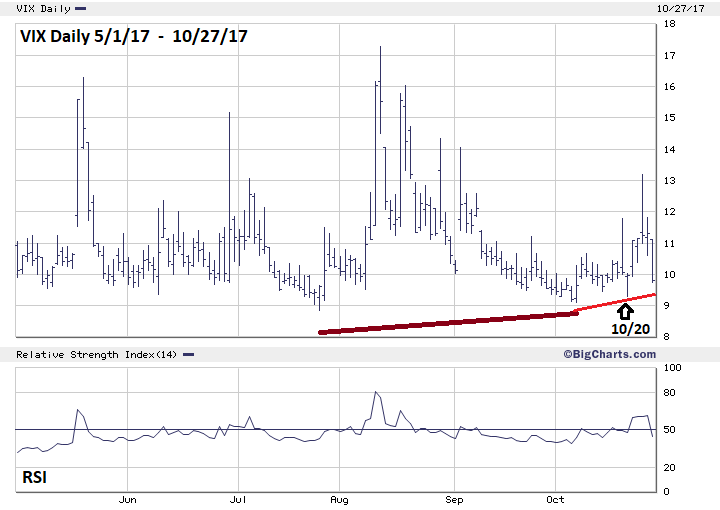
| Signpost #3 Please see the daily VIX chart illustrated in Figure 3. Many of my articles noted that significant SPX tops can occur not when the VIX is hitting new lows but after a divergence. The VIX bottomed on July 26. Since then the SPX has relentlessly pressed higher and now has a series of three divergences with the VIX that happened on October 5, 20, and 27. While the crowed is focused on the fact that the VIX is still at historically low levels, they're missing the subtle rise. The reason VIX is no longer making new lows is that since July 26 more put options are being purchased relative to call options. It takes a lot of money to move the VIX up while the SPX continues to rise. Big money players are buying insurance in the form of put options and their keeping the insurance. It's a good guess that these big players are better informed than the average trader/investor. We don't need to know who they are, we just need to know they are taking steps to protect themselves in the event of a significant stock market decline. |

|
| Figure 3. While the crowd is focused on the fact that the VIX is still at historically low levels, they're missing the subtle rise. |
| Graphic provided by: BigCharts.com. |
| |
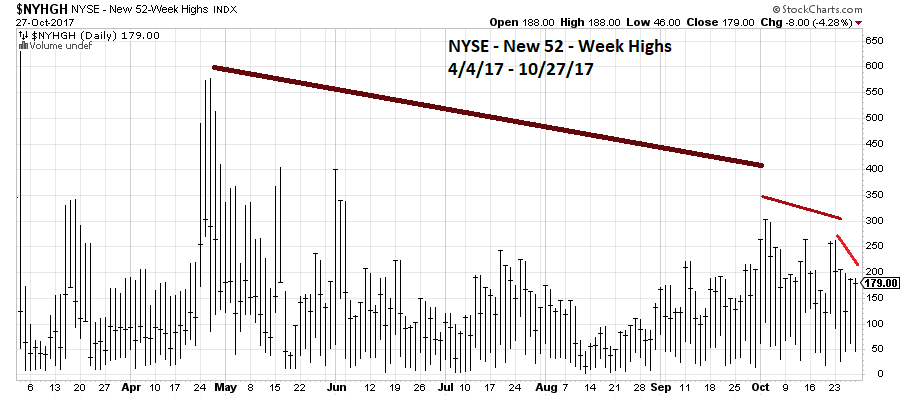
| Signpost #4 - Momentum Please see the daily New NYSE 52-Week High chart illustrated in Figure 4. This chart only shows part of the momentum picture; maximum new highs since the bottom on November 4, 2016 occurred on December 9, 2016 with 778 new NYSE 52-week highs. Subsequently there have been a series of bearish divergences. January 26 had 672 new highs, March 2, 660 and June 1, 401. The problem with momentum indicators is that there can be many divergences and sometimes they can be eliminated — which is what happened with the July divergence that was surpassed in the rally from August 21. Focusing just on the rally from August 21, 2017 we can see a miniature version of the divergence phenomenon that's occurred from December 2016. Maximum new highs were on October 3 with 304. October 23 had 236 and the 27 had just 188. The buying panics of late October 2017 are occurring with fewer and fewer stocks making new highs. At the very least the rally from August 21, 2017 is vulnerable to a complete retracement. |

|
| Figure 4. The buying panics of late October 2017 are occurring with fewer and fewer stocks making new highs. |
| Graphic provided by: StockCharts.com. |
| |
| Conclusion and Strategy By now you are wondering if the relentless stock market rally will ever end. For months the market has blown past resistance areas and ignored bearish seasonal patterns. Hurricanes and nuclear bomb tests barely caused a ripple in the uptrend. Some economic fundamentals are the best they've been in decades. On the surface it looks like the worst possible time to be selling stocks. You need to look carefully to find the psychological signposts — and they're indicating a major top could be forming. Cancel the recommendation to short 25% stocks if the SPX breaks below 2488.00. Short 25% stocks if the SPX breaks below 2544.00 and use the SPX all-time high as the stop loss. Further reading: Frost A.J and Robert Prechter (1985) "Elliott Wave Principle", New Classics Library. Prechter Jr. R. Robert (2003) "Beautiful Pictures", New Classics Library. |
Independent investment advisor, trader and writer. He has written articles for Technical Analysis of Stocks & Commodities, Traders.com Advantage,Futuresmag.com and, Finance Magnates. Author of website Four Dimension Trading.
| Website: | www.fourdimensiontrading.com |
| E-mail address: | markrivest@gmail.com |
Click here for more information about our publications!
PRINT THIS ARTICLE

Request Information From Our Sponsors
- StockCharts.com, Inc.
- Candle Patterns
- Candlestick Charting Explained
- Intermarket Technical Analysis
- John Murphy on Chart Analysis
- John Murphy's Chart Pattern Recognition
- John Murphy's Market Message
- MurphyExplainsMarketAnalysis-Intermarket Analysis
- MurphyExplainsMarketAnalysis-Visual Analysis
- StockCharts.com
- Technical Analysis of the Financial Markets
- The Visual Investor
- VectorVest, Inc.
- Executive Premier Workshop
- One-Day Options Course
- OptionsPro
- Retirement Income Workshop
- Sure-Fire Trading Systems (VectorVest, Inc.)
- Trading as a Business Workshop
- VectorVest 7 EOD
- VectorVest 7 RealTime/IntraDay
- VectorVest AutoTester
- VectorVest Educational Services
- VectorVest OnLine
- VectorVest Options Analyzer
- VectorVest ProGraphics v6.0
- VectorVest ProTrader 7
- VectorVest RealTime Derby Tool
- VectorVest Simulator
- VectorVest Variator
- VectorVest Watchdog
