

HOT TOPICS LIST
- MACD
- Fibonacci
- RSI
- Gann
- ADXR
- Stochastics
- Volume
- Triangles
- Futures
- Cycles
- Volatility
- ZIGZAG
- MESA
- Retracement
- Aroon
INDICATORS LIST
LIST OF TOPICS
PRINT THIS ARTICLE
by Mark Rivest
Ten years after the last major stock market top can another major top be near?
Position: N/A
Mark Rivest
Independent investment advisor, trader and writer. He has written articles for Technical Analysis of Stocks & Commodities, Traders.com Advantage,Futuresmag.com and, Finance Magnates. Author of website Four Dimension Trading.
PRINT THIS ARTICLE
MARKET TIMING
Comparing October 2007 to October 2017
10/12/17 01:27:24 PMby Mark Rivest
Ten years after the last major stock market top can another major top be near?
Position: N/A
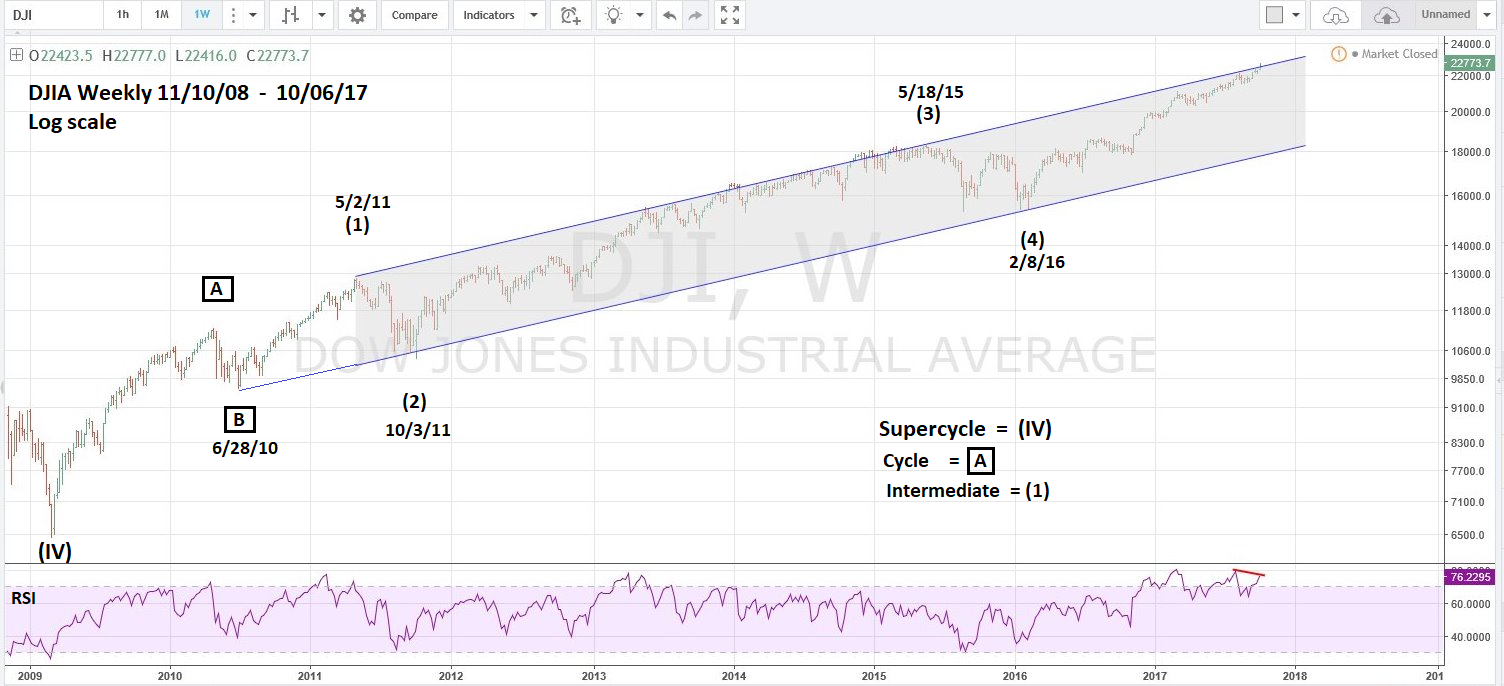
| October 2007 marked the end of a five-year stock bull market and the beginning of a devastating seventeen-month bear market. Price evidence from the Dow Jones Industrial Average (DJIA) indicates a major resistance area may have been reached. At the very least an intermediate decline of 15-16% could be imminent. Dow Jones Industrial Average — Weekly When determining Elliott wave patterns and potential turning points for the stock market it's best to find an index that closely reflects the mass mind. The S&P 500 (SPX) is used by money managers as a bench mark for their performance and is usually a very good indicator to discover intermediate and major turning points. My May 10 article "The Price is Right" noted two major Fibonacci points in the SPX 2450 area and allowed for leeway up to 2510. My October 5 article "Stock Market Decision Point" noted that the recent SPX move above 2510 weakened the case that a significant peak was imminent. However, the DJIA which is perceived by the public to be "the market" can also be a very good gauge to discover significant turning points. Please see the DJIA weekly chart illustrated in Figure 1. Since May of 2011 the DJIA has stayed almost entirely within the confines of a perfect parallel trend channel, with only a marginal break below the lower trend line in October 2011 and the so far marginal break above the upper trend line in October 2017. This channel provides powerful evidence that a text book five-wave Elliott pattern from April 2010 could be near completion. There's also a significant Fibonacci coordinate that's in the same area of the upper trend line. Typically, there's a Fibonacci price relationship between waves "one" and "five". The growth of the supposed DJIA intermediate wave (1) was 33.90% multiplied by 1.382 equals 46.85% adding this growth to the supposed wave (4) ending point in February 2016 targets DJIA 22,766. The high on October 5 was 22,777. |
|
| Figure 1. This channel provides powerful evidence that a text book five-wave Elliott pattern from April 2010 could be near completion. |
| Graphic provided by: Tradingview.com. |
| |
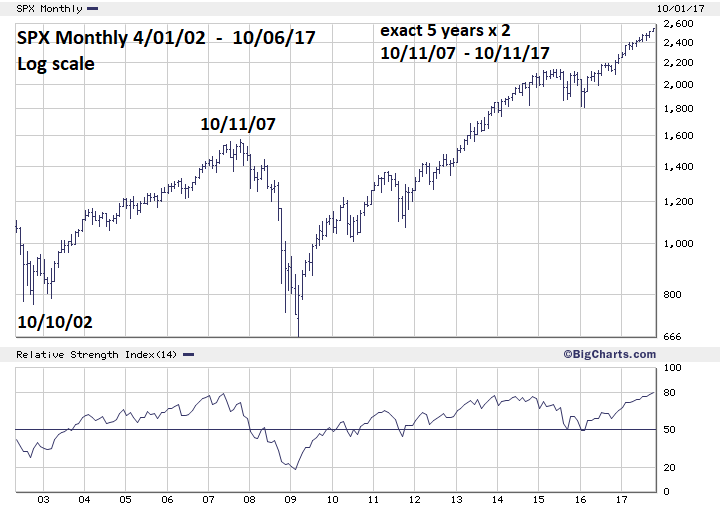
| Time Dimension R.N. Elliott discovered that sometimes markets move in time segments related to the Fibonacci Sequence (1, 1, 2, 3, 5, 8, 13, 21, 34, 55, 89, 144, to infinity). Most of the time when measuring years there's wide leeway. For example, the DJIA 1932-1937 bull market was five years — a Fibonacci sequence number, however the exact measurement was four months short of an exact five years. However, there are rare examples of amazing precision. Please see the monthly SPX chart illustrated in Figure 2. The five-year bull market from 2002-2007 was only one day beyond exactly five years. Incredible! Using Fibonacci time ratio analysis there could be a connection between the October 2007 top with a potential October 2017 top. Two times an exact five years targets October 11, 2017. There could also be a smaller scale Fibonacci time ratio forming. It's forty-eight months from the SPX May 2011 peak and the May 2015 top. Multiplied by .618 equals twenty-nine months added to the May 2015 top targets October 2017. |
|
| Figure 2. Using Fibonacci time ratio analysis there could be a connection between the October 2007 top with a potential October 2017 top. |
| Graphic provided by: BigCharts.com. |
| |
| Conclusion and Strategy Mid-August to early November is perhaps the strongest bearish seasonal stock market pattern. The October 11, 2007 major stock market peak proves a significant peak could be forming in early October 2017. In 2007 the normally very bullish month of November end down 4% this was a major clue that something larger than an ordinary correction was underway. If November 2017 is a down month, it could also be a major clue that something much more bearish than a correction could develop. Markets tend to rally/decline into specific events. Since August 21 the main US stock indices have been on a relentless rally. On October 6 the very important US employment report was issued and both the DJIA and SPX closed the day down slightly after failing to make new all-time highs. Only the Nasdaq Composite made a new high and finished the day up slightly. This bearish divergence among the three main US stock indices could be a signal the rally from mid-August is complete. October 6 is only five days before the ten-year anniversary of the October 2007 top. Considering this is a time span of a decade, if a top was made on October 6, five days leeway is amazingly accurate. If the SPX breaks below 2488.00 short 25% stocks and use the 2017 high as the stop loss. The thirty- four-day mini crash phenomenon first mentioned in my September 8 article could still be in effect. Assuming the October 6 peak holds, the bulls-eye date for the crash bottom is November 8, 2017. Price target zone for a mini crash bottom is SPX 2120-2160. Further Reading: Frost A.J and Robert Prechter (1985) "Elliott Wave Principle", New Classics Library. |
Independent investment advisor, trader and writer. He has written articles for Technical Analysis of Stocks & Commodities, Traders.com Advantage,Futuresmag.com and, Finance Magnates. Author of website Four Dimension Trading.
| Website: | www.fourdimensiontrading.com |
| E-mail address: | markrivest@gmail.com |
Click here for more information about our publications!
PRINT THIS ARTICLE

Request Information From Our Sponsors
- VectorVest, Inc.
- Executive Premier Workshop
- One-Day Options Course
- OptionsPro
- Retirement Income Workshop
- Sure-Fire Trading Systems (VectorVest, Inc.)
- Trading as a Business Workshop
- VectorVest 7 EOD
- VectorVest 7 RealTime/IntraDay
- VectorVest AutoTester
- VectorVest Educational Services
- VectorVest OnLine
- VectorVest Options Analyzer
- VectorVest ProGraphics v6.0
- VectorVest ProTrader 7
- VectorVest RealTime Derby Tool
- VectorVest Simulator
- VectorVest Variator
- VectorVest Watchdog
- StockCharts.com, Inc.
- Candle Patterns
- Candlestick Charting Explained
- Intermarket Technical Analysis
- John Murphy on Chart Analysis
- John Murphy's Chart Pattern Recognition
- John Murphy's Market Message
- MurphyExplainsMarketAnalysis-Intermarket Analysis
- MurphyExplainsMarketAnalysis-Visual Analysis
- StockCharts.com
- Technical Analysis of the Financial Markets
- The Visual Investor