

HOT TOPICS LIST
- MACD
- Fibonacci
- RSI
- Gann
- ADXR
- Stochastics
- Volume
- Triangles
- Futures
- Cycles
- Volatility
- ZIGZAG
- MESA
- Retracement
- Aroon
INDICATORS LIST
LIST OF TOPICS
PRINT THIS ARTICLE
by Mark Rivest
The fate of the eight-year stock bull market could be decided in early October.
Position: N/A
Mark Rivest
Independent investment advisor, trader and writer. He has written articles for Technical Analysis of Stocks & Commodities, Traders.com Advantage,Futuresmag.com and, Finance Magnates. Author of website Four Dimension Trading.
PRINT THIS ARTICLE
MARKET TIMING
Stock Market Decision Point
10/05/17 04:54:20 PMby Mark Rivest
The fate of the eight-year stock bull market could be decided in early October.
Position: N/A
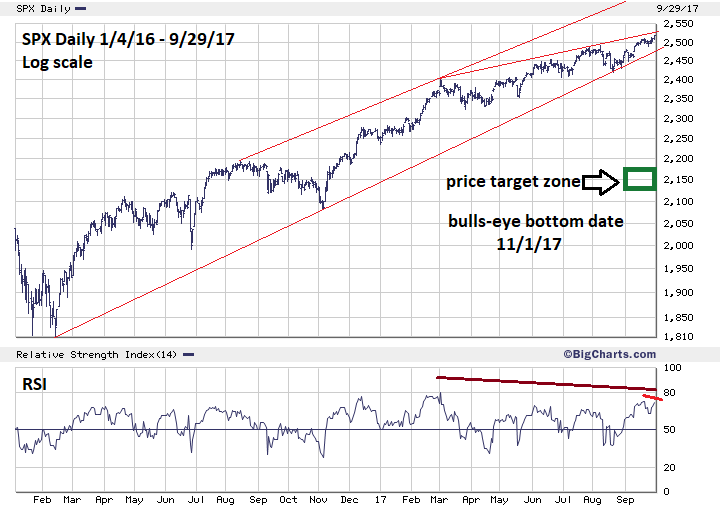
| For several months the global stock market has exhibited many signs that a significant peak could be forming. The bulls have so far shrugged off all these signals and have slowly and steadily pushed the market indices higher. The prime bearish seasonal time from mid-August to early-November is shrinking, early October could be the bears last chance for a significant decline. S&P 500 Daily Please see the daily S&P 500 (SPX) chart illustrated in Figure 1. Since mid-August all four market dimensions, Momentum, Sentiment, Price and Time, have been bearish for stocks. Multiple bearish momentum divergences have been prevalent for several months. Both short-term and long-term sentiment has been signaling a potentially significant peak forming. The price dimension up until the week of September 25-29 had three long term Fibonacci resistance points. My May 10th article "The Price is Right" noted SPX 2454.10 and 2459.30 as potential resistance points. A third Fibonacci coordinate derived from the SPX 2007-2009 decline of 909.30 points multiplied by two and added to the 2009 SPX bottom at 666.79 targeted 2485.39 as potential resistance. Whenever using Fibonacci coordinates allow for leeway, in this case because the target points are derived from multi-year price structures — upper leeway extended up to round number resistance at 2500. On the week of September 25-29 the SPX pushed above round number leeway at 2510. The SPX high on September 29 was 2519.44. Determining leeway is not an exact science, the levels can vary. A case could be made that 2519.44 could still be in the marginal range of 2500, however also moving above three Fibonacci coordinates adds to the belief that upside resistance may have been broken. Markets can have significant turns at any point, there doesn't have to be Fibonacci coordinates or round numbers to act as barriers. They indicate high probable turning points not certainty. If upside SPX upside resistance has been broken, the next major Fibonacci point that could attract the SPX is 2852.00. This is calculated by multiplying the 2007-2009 decline of 909.30 by 2.382 and adding it to the 666.79 bottom. If the Price dimension is no longer a bearish factor, the focus is now on the Time dimension. If the SPX fails to top in the week of October 2-6 there may not be enough time for a significant 14-16% decline. If strong seasonally bullish factors take effect in early November, a potential decline may only be in the 4 -5% range. |
|
| Figure 1. The price dimension up until the week of September 25-29 had three long term Fibonacci resistance points. |
| Graphic provided by: BigCharts.com. |
| |
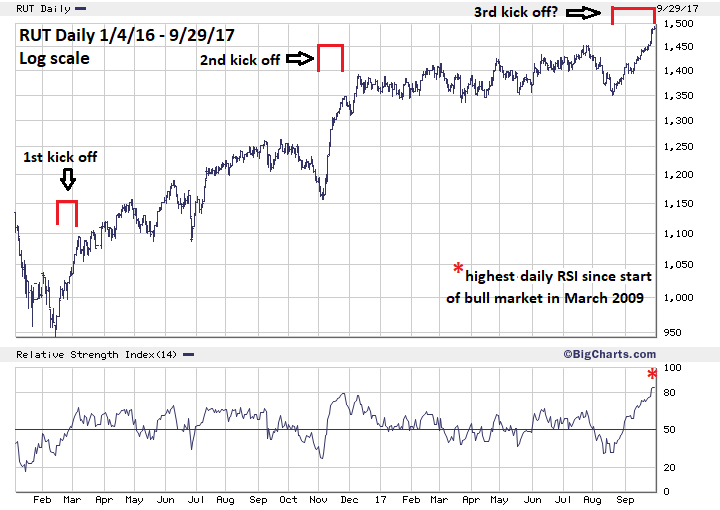
| Russell 2000 Daily. Please see the daily Russell 2000 (RUT) chart in Figure 2. Since mid-August the most powerful sector of the US stock market has been small cap stocks. From August 18 to September 29 RUT is up 10.30% vs. only a 4% SPX rise. RUT could be in the third kick off rally since the last significant bottom made in February 2016. If so, RUT could soon go into a shallow decline then resume the rally at a slower pace. If RUT goes into a decline that is larger relative to the post kick off declines of March and November 2016, it could be a major clue that a significant decline is underway. The daily RUT RSI has registered its highest reading of the entire bull market since March 2009. Short term this is bullish because stock indices almost always have at least one bearish RSI before a top is in place. There's a bearish weekly RSI divergence vs the December 2016 RUT peak. RUT could be the most important stock index to follow in early October. |
|
| Figure 2. RUT could be the most important stock index to follow in early October. |
| Graphic provided by: BigCharts.com. |
| |
| Conclusion and Strategy The SPX upper daily trend line from March 1 on the Log scale chart is in the 2520 area. A move above SPX 2530 during the first week of October could be additional bullish evidence. A break below the lower trend line from February 2016, now in the 2470 area, could be additional bearish evidence. The short stop loss level at 2510 was hit in the last week of September. If the SPX begins declining during the first week of October there could be enough time to reach significant support in the SPX areas of 2120-2160. If the SPX has made a top on September 29 the bottom target date based upon the thirty-four-day mini crash phenomenon is November 1, 2017. If the SPX breaks below 2488.00 short 25% stocks and use the 2017 high as the stop loss. If in early October the SPX breaks above 2530 it could be too risky to initiate long positions because of bearish seasonality. A safer opportunity to go long could present itself in late October. |
Independent investment advisor, trader and writer. He has written articles for Technical Analysis of Stocks & Commodities, Traders.com Advantage,Futuresmag.com and, Finance Magnates. Author of website Four Dimension Trading.
| Website: | www.fourdimensiontrading.com |
| E-mail address: | markrivest@gmail.com |
Click here for more information about our publications!
PRINT THIS ARTICLE

Request Information From Our Sponsors
- VectorVest, Inc.
- Executive Premier Workshop
- One-Day Options Course
- OptionsPro
- Retirement Income Workshop
- Sure-Fire Trading Systems (VectorVest, Inc.)
- Trading as a Business Workshop
- VectorVest 7 EOD
- VectorVest 7 RealTime/IntraDay
- VectorVest AutoTester
- VectorVest Educational Services
- VectorVest OnLine
- VectorVest Options Analyzer
- VectorVest ProGraphics v6.0
- VectorVest ProTrader 7
- VectorVest RealTime Derby Tool
- VectorVest Simulator
- VectorVest Variator
- VectorVest Watchdog
- StockCharts.com, Inc.
- Candle Patterns
- Candlestick Charting Explained
- Intermarket Technical Analysis
- John Murphy on Chart Analysis
- John Murphy's Chart Pattern Recognition
- John Murphy's Market Message
- MurphyExplainsMarketAnalysis-Intermarket Analysis
- MurphyExplainsMarketAnalysis-Visual Analysis
- StockCharts.com
- Technical Analysis of the Financial Markets
- The Visual Investor