HOT TOPICS LIST
- MACD
- Fibonacci
- RSI
- Gann
- ADXR
- Stochastics
- Volume
- Triangles
- Futures
- Cycles
- Volatility
- ZIGZAG
- MESA
- Retracement
- Aroon
INDICATORS LIST
LIST OF TOPICS
PRINT THIS ARTICLE
by Mark Rivest
The relationship of Crude Oil and Stocks could reveal economic weakness.
Position: Hold
Mark Rivest
Independent investment advisor, trader and writer. He has written articles for Technical Analysis of Stocks & Commodities, Traders.com Advantage,Futuresmag.com and, Finance Magnates. Author of website Four Dimension Trading.
PRINT THIS ARTICLE
MARKET TIMING
Crude Oil And Stock Market Connection
02/21/19 04:30:01 PMby Mark Rivest
The relationship of Crude Oil and Stocks could reveal economic weakness.
Position: Hold
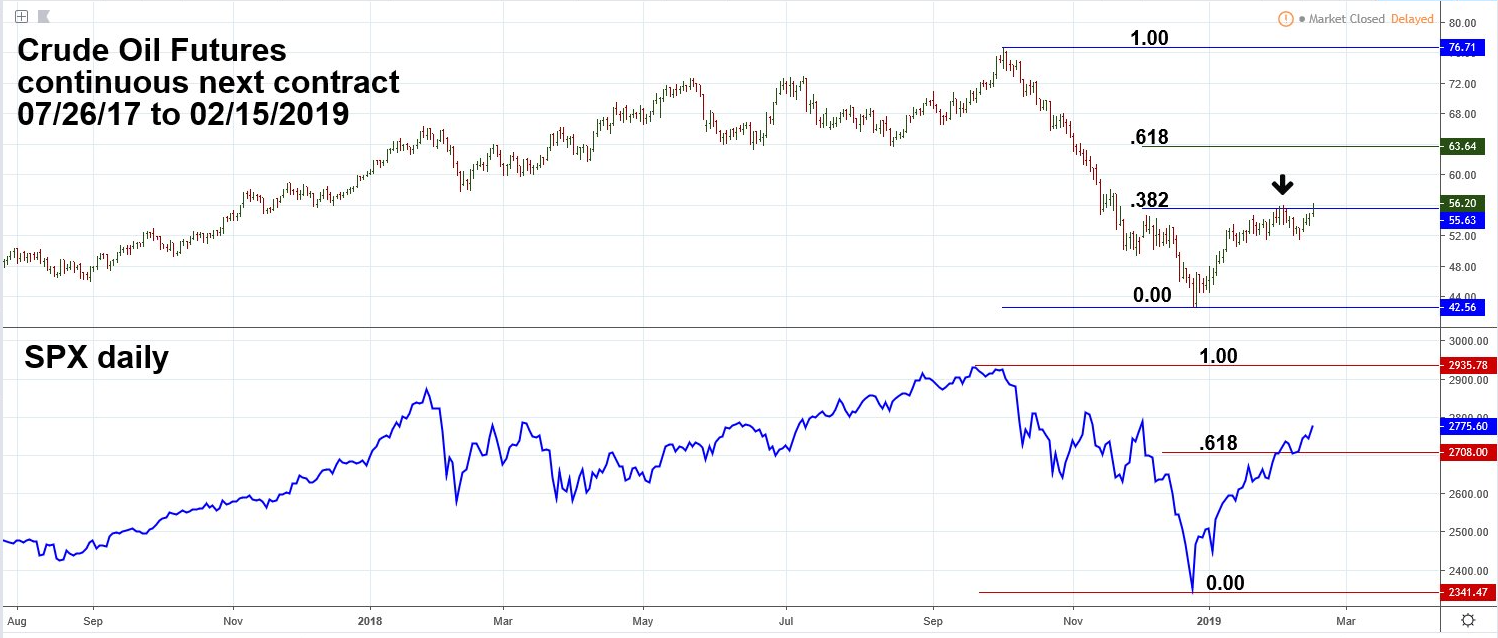
| Market momentum can be measured in many ways. Oscillators such as Stochastics and RSI are common tools. In the stock market, momentum can be gauged by relationship between sectors such as Transportation and Industrial stocks. Occasionally, there can an inter-market relationship, such as what has been happening between Crude Oil and US stocks since mid-2015. This pair could be yielding the first sign of a slowing economy. Crude Oil vs. S&P 500 The daily Crude Oil and S&P 500 (SPX) chart illustrated in Figure 1 shows the close relationship between the markets. My January 10 article "Birth of a Crude Oil Bull Market?" noted that evidence from all four market dimensions implied a Crude Oil bull market had begun. Additionally, because of the close relationship with US stocks, the bullish evidence from Crude Oil increased the probabilities a significant stock market bottom was in place. Since the late 2018 bottom, both markets have rallied, with the SPX and other US stock indices taking the lead. As of February 15, the SPX had retraced 72% of its late 2018 decline, while Crude Oil has retraced only 40%. If Crude Oil continues to lag it could develop into a significant bearish signal for both markets, and the economy. My February 1, 2018 article "How High is Up?" speculated that the SPX could make a significant top at 3047. This level was calculated by the SPX 2007 to 2009 decline of 909.30 points multiplied by the Fibonacci ratio of 2.618 which yielded 2380.54 points, added to the SPX major bottom made in March 2009 of 666.79 targeted SPX 3047.33. If the SPX reaches 3047 in the next several weeks and Crude Oil has failed to exceed its October 2018 high of 76.72, this could be a significant bearish signal for both markets. |

|
| Figure 1. Crude Oil vs. S&P 500. Since the late 2018 bottom both markets have rallied, with the SPX and other US stock indices taking the lead. |
| Graphic provided by: tradingview.com. |
| |
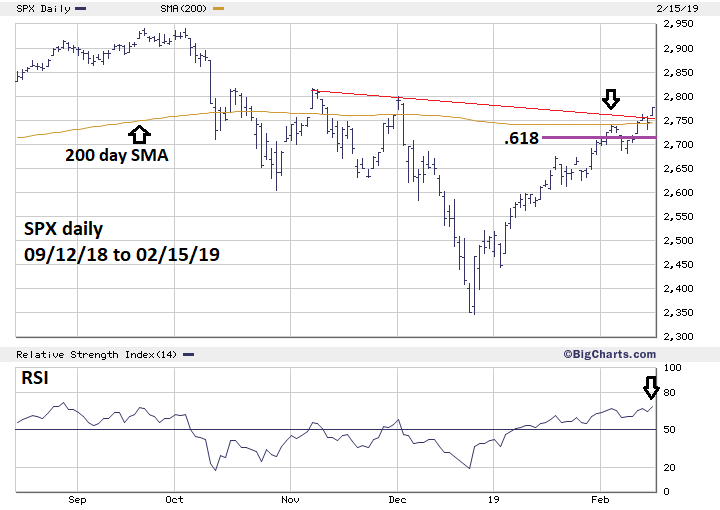
| S&P 500 During the trading week of February 11-15 the SPX broke above three significant resistance points: a break above the declining trend line connecting the November and December short term tops, a decisive move above the .618 retrace of the September to December decline, and, most importantly, above the 200-day Simple Moving Average (SMA), which is perhaps the most widely watched indicator for stock fund managers. Please see the daily SPX chart illustrated in Figure 2. The break out could trigger new fund long positions. Could this recent SMA break out be another false signal like what happened in October and November 2018? Unlikely; note that on February 5 the SPX touched the 200-day SMA and the declined for three trading days. The meager 2% drop was quickly rejected. The bears had their chance to push the SPX down and blew it. Additional short-term bullish evidence comes from the daily RSI which confirmed the SPX new rally high. The post December rally high on February 15 was right on the close; most of the time when a market closes at the high of the day there's upside follow through for at least one trading day. February 15 was a Friday, Monday the US stock market is closed for Presidents' Day. Traders are not worried about additional event risk over the three-day weekend. Finally, note on the Crude Oil chart that February 15 Crude Oil broke above the 0.382 resistance zone and the short-term top made on February 4. It appears, for at least the short term, both markets have more upside potential. |

|
| Figure 2. SPX Daily. During the trading week of February 11-15 the SPX broke above three significant resistance points. |
| Graphic provided by: BigCharts.com. |
| |
| Comprehensive Analysis Perhaps you trade just Crude Oil and have no interest in stocks, the same could be said of stock traders not having any interest in Crude Oil. Regardless of what markets you trade, it's very important to analyze other markets even if you don't trade them. Both Crude Oil and the SPX have been closely matching each other since mid-2015. Crude Oil is seasonally bullish until April, US stocks usually rally into May. Both markets could continue higher at least into March. Crude Oil is the World's fuel, its inability to match the rise of the SPX could be the first sign of economic weakness. A robust economy should translate into strong demand for Crude Oil and higher prices which should be matching the rise in the SPX. Watch both the SPX and Crude Oil. A new SPX all-time high, especially if it reaches the low 3000 area, with Crude Oil below its October 2018 high could be a rally killer for both markets. |
Independent investment advisor, trader and writer. He has written articles for Technical Analysis of Stocks & Commodities, Traders.com Advantage,Futuresmag.com and, Finance Magnates. Author of website Four Dimension Trading.
| Website: | www.fourdimensiontrading.com |
| E-mail address: | markrivest@gmail.com |
Click here for more information about our publications!
Comments
Date: 02/21/19Rank: 4Comment:

Request Information From Our Sponsors
- StockCharts.com, Inc.
- Candle Patterns
- Candlestick Charting Explained
- Intermarket Technical Analysis
- John Murphy on Chart Analysis
- John Murphy's Chart Pattern Recognition
- John Murphy's Market Message
- MurphyExplainsMarketAnalysis-Intermarket Analysis
- MurphyExplainsMarketAnalysis-Visual Analysis
- StockCharts.com
- Technical Analysis of the Financial Markets
- The Visual Investor
- VectorVest, Inc.
- Executive Premier Workshop
- One-Day Options Course
- OptionsPro
- Retirement Income Workshop
- Sure-Fire Trading Systems (VectorVest, Inc.)
- Trading as a Business Workshop
- VectorVest 7 EOD
- VectorVest 7 RealTime/IntraDay
- VectorVest AutoTester
- VectorVest Educational Services
- VectorVest OnLine
- VectorVest Options Analyzer
- VectorVest ProGraphics v6.0
- VectorVest ProTrader 7
- VectorVest RealTime Derby Tool
- VectorVest Simulator
- VectorVest Variator
- VectorVest Watchdog
