HOT TOPICS LIST
- MACD
- Fibonacci
- RSI
- Gann
- ADXR
- Stochastics
- Volume
- Triangles
- Futures
- Cycles
- Volatility
- ZIGZAG
- MESA
- Retracement
- Aroon
INDICATORS LIST
LIST OF TOPICS
PRINT THIS ARTICLE
by Mark Rivest
Evidence from all four market dimensions imply a bull market has begun for Crude Oil.
Position: Buy
Mark Rivest
Independent investment advisor, trader and writer. He has written articles for Technical Analysis of Stocks & Commodities, Traders.com Advantage,Futuresmag.com and, Finance Magnates. Author of website Four Dimension Trading.
PRINT THIS ARTICLE
MARKET TIMING
Birth of a Crude Oil Bull Market?
01/10/19 03:35:33 PMby Mark Rivest
Evidence from all four market dimensions imply a bull market has begun for Crude Oil.
Position: Buy
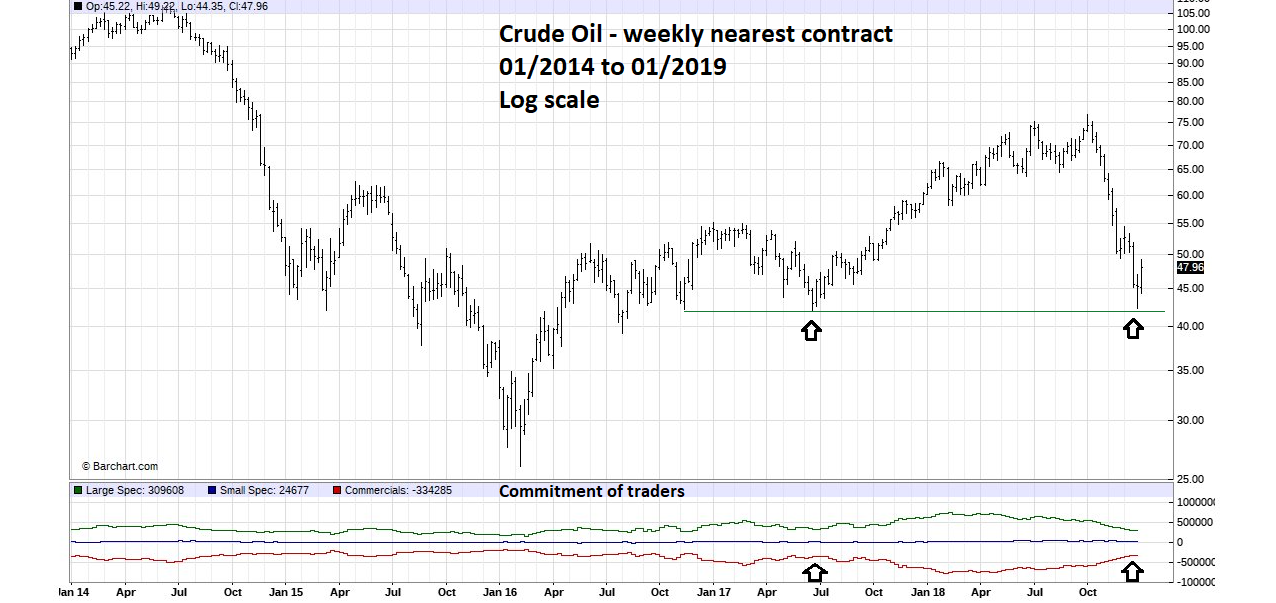
| From October to December 2018, both the US stock market and Crude Oil experienced sharp declines. The S&P 500(SPX) bottomed on December 26, while Crude Oil bottom was on December 24. Powerful evidence suggests Crude Oil could be in the early phase of a rally lasting several months, with a corresponding move up for US stocks. Seasonal and Sentiment Factors Crude Oil has a seasonal tendency to rally from January to April and occasionally important bottoms have formed late December to February. Examples are: December 2004, January 2007, February 2009, and January 2016. Please see the Crude Oil weekly chart illustrated in Figure 1. This chart indicates the Commitment of Traders report that's published weekly. It shows the net long/short positions of three groups of traders: Commercials, Large Speculators, and Small Speculators. The Commercials are the group you want to follow as they have the most money. Note that the recent Crude Oil bottom in December 2018 had the smallest Commercial net short position since the significant bottom made in June of 2017. A note of caution when following the Commercials — most of the time they are hedging their product and occasionally are premature when increasing hedge size. Note the very large net short position they took late 2017 and early 2018. The Commercials had to endure several months of a rally before the sharp October to December decline. |

|
| Figure 1. Note that the recent Crude Oil bottom in December 2018 had the smallest Commercial net short position since the significant bottom made in June of 2017. |
| Graphic provided by: Barcharts.com. |
| |
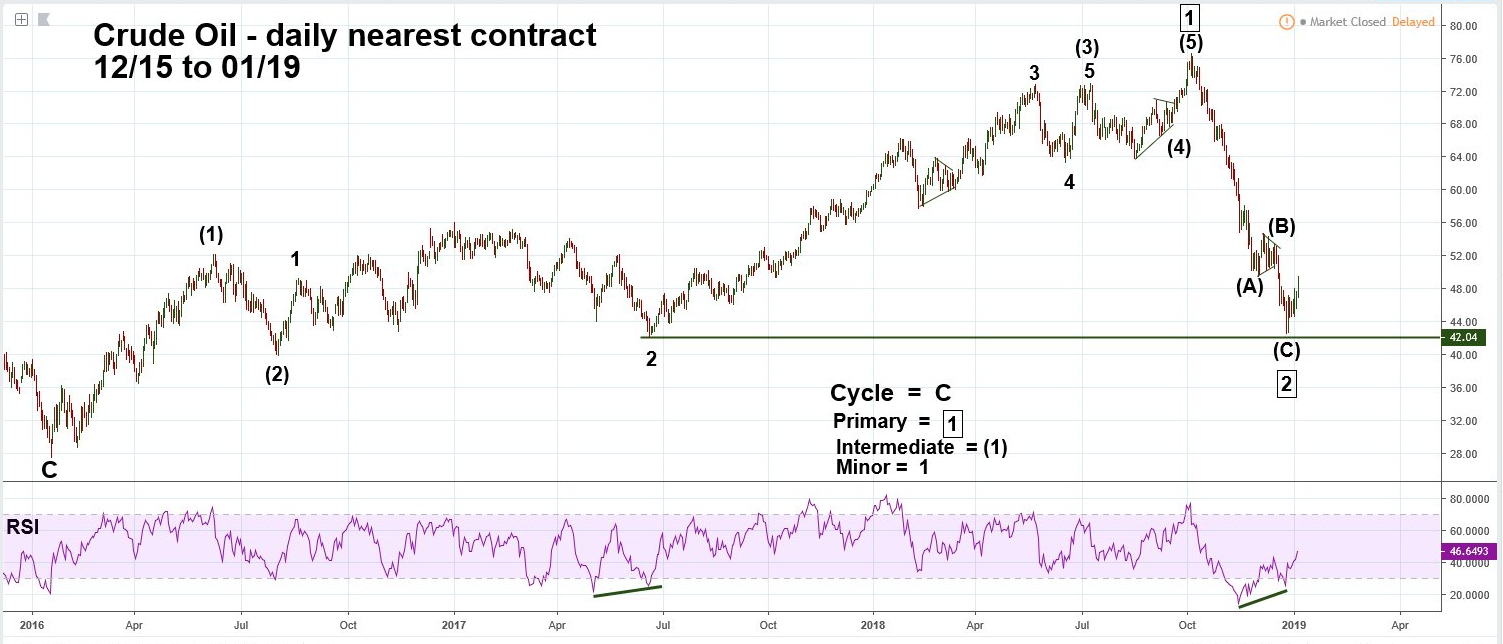
| Price and Momentum Factors Please see the daily Crude Oil chart illustrated in Figure 2. From September 2016 to June 2017 there was choppy price action that made Elliott wave counting difficult. The subsequent rally from June 2017 to October 2018 cleared up the wave count and it now appears that five waves up from the major bottom in January 2016 is complete. The decline from October to December counts as a three-wave corrective pattern. The size of drop is what would be expected for a retracement of the supposed Primary wave "1". A break below the December 24 bottom could be very bearish and open the door for a fall all the way back to the major bottom made in January 2016. Note the significant RSI bullish divergence made at the December 2018 bottom is like the bullish divergence made in June 2017. The bullish divergence combined with the supposed corrective pattern of October to December implies a multi-month rally at least back to the October 2018 high. |

|
| Figure 2. Note the significant RSI bullish divergence made at the December 2018 bottom is like the bullish divergence made in June 2017. |
| Graphic provided by: tradingview.com. |
| |
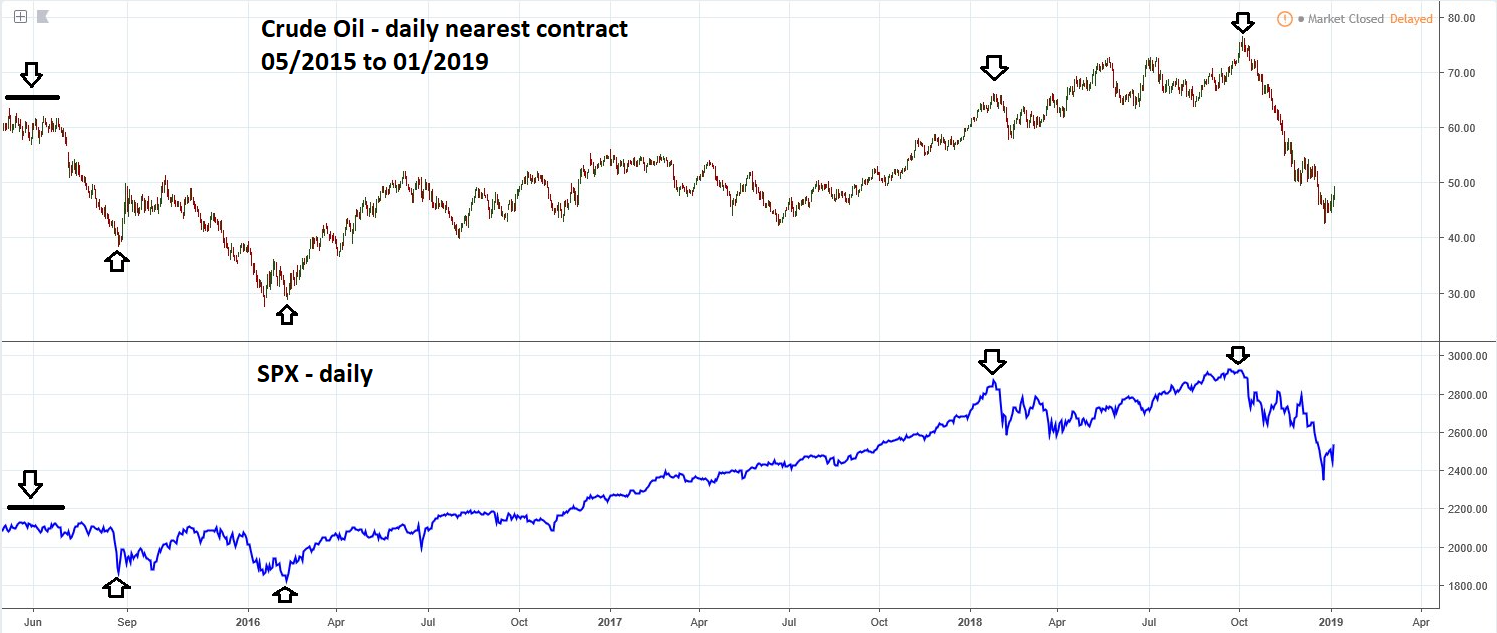
| Crude Oil and S&P 500 Occasionally two market will trend together. The daily Crude Oil and SPX chart illustrated in Figure 3 notes five points where both markets were in sync. The pairing began in mid-2015 when the SPX was in a flat topping zone. Next, both markets bottomed about the same time after the August 2015 stock market mini crash. Later, Crude Oil and stocks made important bottoms in early 2016. The next significant turn came in early 2018 when both markets topped and abruptly turned down. Finally, Crude Oil's peak on October 3 corresponded with a marginally lower SPX top followed by a sharp decline into late December. Since the late December bottoms, both markets have rallied together. My January 3rd article "Death of a Bull Market?" noted that sentiment and momentum indicators for the US stock market had reached levels strongly suggesting a bottom could be forming. Now with additional evidence from the Crude Oil market, the probabilities have increase that both markets have made significant bottoms. When markets trend together the condition is not permanent — at some point they will decouple. If at any point the relationship diverges, it could be a clue to a trend change for one market. |

|
| Figure 3. The pairing began in mid-2015 when the SPX was in a flat topping zone. |
| Graphic provided by: tradingview.com. |
| |
| Summary The main evidence for Crude Oil: Time Dimension: Bullish seasonal pattern January to April. Price Dimension: December bottom was just above prior significant support. Sentiment Dimension: Commercials have the smallest net short position since the June 2017 bottom. Momentum Dimension: Significant daily RSI bullish divergence at the December 24 bottom. Bullish evidence from all four market dimensions implies Crude Oil could rally until at least April and, at some time, retest the October 2018 high at 76.72. US stocks will likely continue trending with Crude Oil. Further Reading: Frost A.J and Robert Prechter (1985) "Elliott Wave Principle", New Classics Library. |
Independent investment advisor, trader and writer. He has written articles for Technical Analysis of Stocks & Commodities, Traders.com Advantage,Futuresmag.com and, Finance Magnates. Author of website Four Dimension Trading.
| Website: | www.fourdimensiontrading.com |
| E-mail address: | markrivest@gmail.com |
Click here for more information about our publications!
Comments
Date: 01/10/19Rank: 4Comment:

|

Request Information From Our Sponsors
- StockCharts.com, Inc.
- Candle Patterns
- Candlestick Charting Explained
- Intermarket Technical Analysis
- John Murphy on Chart Analysis
- John Murphy's Chart Pattern Recognition
- John Murphy's Market Message
- MurphyExplainsMarketAnalysis-Intermarket Analysis
- MurphyExplainsMarketAnalysis-Visual Analysis
- StockCharts.com
- Technical Analysis of the Financial Markets
- The Visual Investor
- VectorVest, Inc.
- Executive Premier Workshop
- One-Day Options Course
- OptionsPro
- Retirement Income Workshop
- Sure-Fire Trading Systems (VectorVest, Inc.)
- Trading as a Business Workshop
- VectorVest 7 EOD
- VectorVest 7 RealTime/IntraDay
- VectorVest AutoTester
- VectorVest Educational Services
- VectorVest OnLine
- VectorVest Options Analyzer
- VectorVest ProGraphics v6.0
- VectorVest ProTrader 7
- VectorVest RealTime Derby Tool
- VectorVest Simulator
- VectorVest Variator
- VectorVest Watchdog
