

HOT TOPICS LIST
- MACD
- Fibonacci
- RSI
- Gann
- ADXR
- Stochastics
- Volume
- Triangles
- Futures
- Cycles
- Volatility
- ZIGZAG
- MESA
- Retracement
- Aroon
INDICATORS LIST
LIST OF TOPICS
PRINT THIS ARTICLE
by Mark Rivest
How to trade US stocks at the beginning of 2019.
Position: Buy
Mark Rivest
Independent investment advisor, trader and writer. He has written articles for Technical Analysis of Stocks & Commodities, Traders.com Advantage,Futuresmag.com and, Finance Magnates. Author of website Four Dimension Trading.
PRINT THIS ARTICLE
FIBONACCI
Death of a Bull Market?
01/03/19 04:27:24 PMby Mark Rivest
How to trade US stocks at the beginning of 2019.
Position: Buy
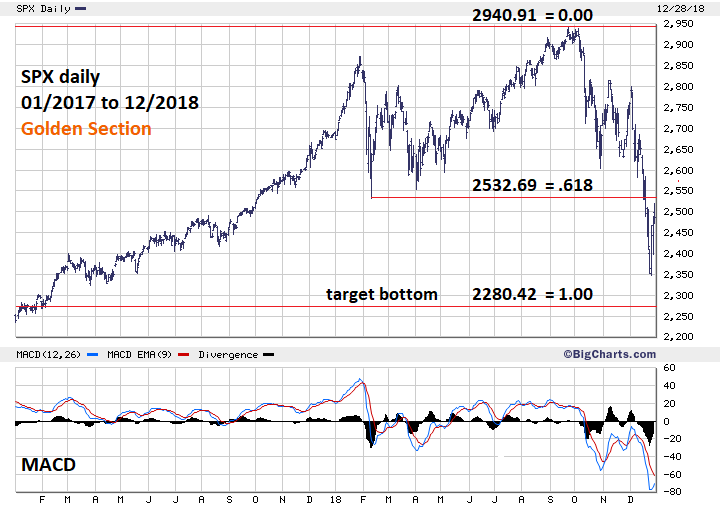
| The US stock market has been in a precipitous decline since breaking important support made in February 2018. Near term evidence is growing that a bottom is in place, or could be very soon. Two S&P 500 (SPX) price areas could be the starting point for a rally lasting at least several weeks. Fibonacci Golden Section Occasionally when a market breaks below an important support level a Fibonacci Golden Section could be formed. Please see the Two-year daily SPX chart illustrated in Figure 1. In this situation the important support is at SPX 2532.69; the difference between this level and the all-time high at 2940.91 is 408.22 points. Multiplying 408.22 by the Fibonacci ratio of .618 yields 252.27 points. Subtracting 252.27 from the nexus of 2532.69 targets SPX 2280.42 as the next significant support point. If this develops a Fibonacci Golden Section will be formed with .618 of the total decline above 2532.69 and .382 of the decline below. Note that the daily MACD reached the most oversold level in two years at the SPX December 26 bottom of 2346.58. This could mean a bottom is in place at that level, or perhaps the SPX could make a lower bottom with the MACD developing a bullish divergence. |
|
| Figure 1. Note that the daily MACD reached the most oversold level in two years at the SPX December 26th bottom of 2346.58. |
| Graphic provided by: BigCharts.com. |
| |
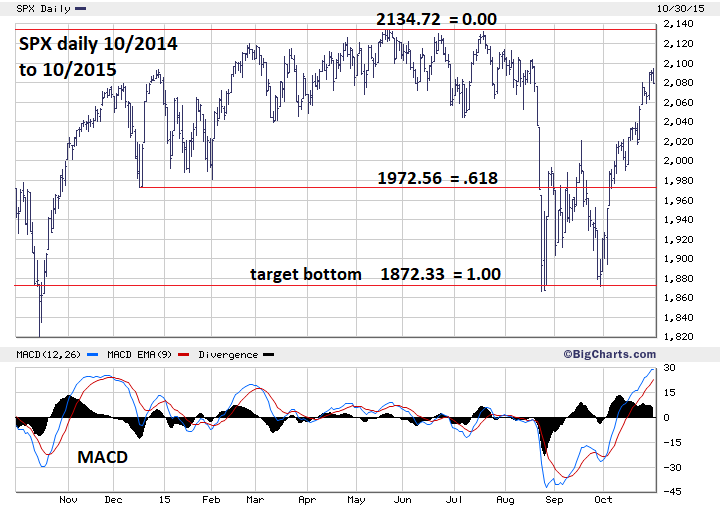
| S&P 500 in 2015 The most significant recent example of the Golden Section phenomenon is the SPX mini crash in August 2015. Please see the SPX daily chart 10/2014 to 10/2015 illustrated in Figure 2. In that situation the nexus was SPX 1972.56, the break of that level triggered the largest and final day of the mini crash. The actual bottom of 1867.01 was just 5.32 points below the bull's eye target. Note however the September 29, 2015 retest of the low was at 1871.91 — a difference of only .43 points. The MACD at the August 2015 mini crash bottom reached the most oversold level recorded since the SPX 2011 correction. The SPX did not break the August 2015 bottom until January 2016 where the daily MACD histogram had a bullish divergence. In February the SPX made a marginal new low with both the MACD histogram and lines at bullish divergences. |
|
| Figure 2. The most significant recent example of the Golden Section phenomenon is the SPX mini crash in August 2015. |
| Graphic provided by: BigCharts.com. |
| |
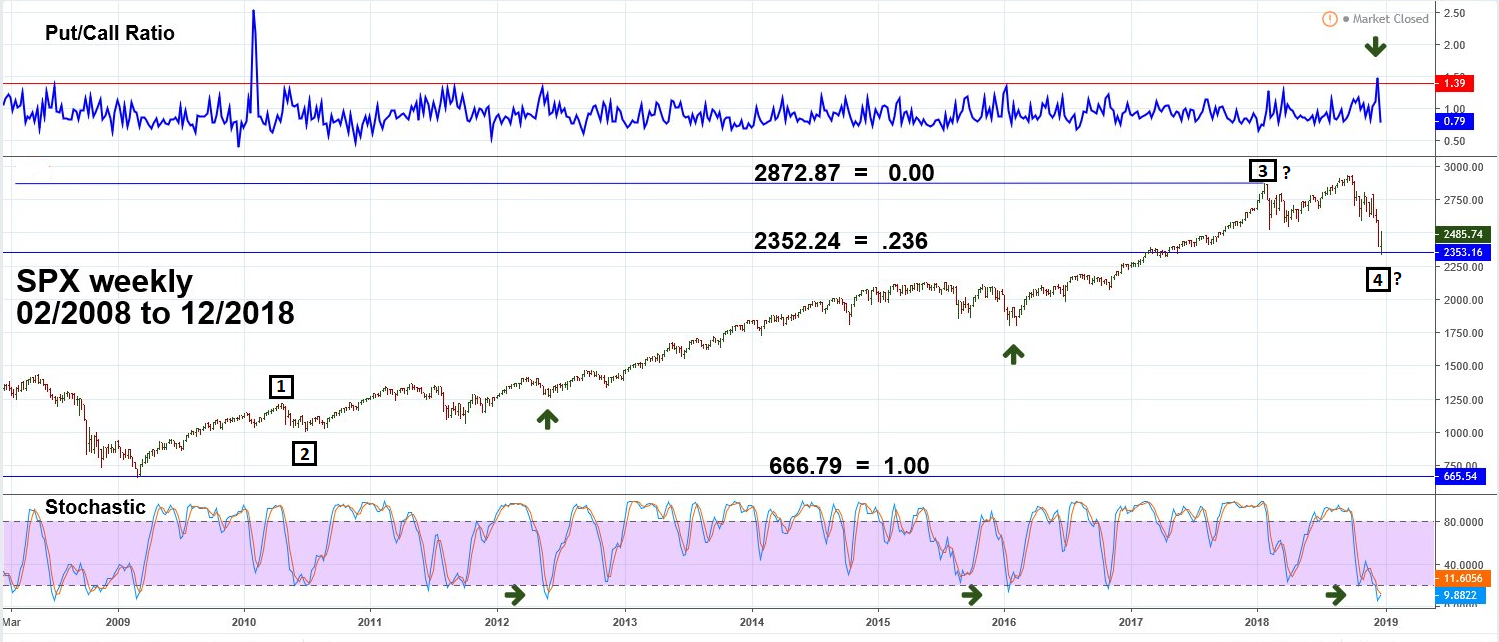
| SPX Weekly Chart It's possible the SPX has already made a significant bottom at 2346. Please see the SPX weekly chart illustrated in Figure 3. One Elliott wave alternate count has the January 2018 top as the termination point for primary wave "3" of the bull market from the March 2009 bottom. The pattern after the January 2018 peak could be a combination wave correction; these are like Expanding Flats, except the third phase of the correction does not subdivide into five waves. When a corrective pattern moves beyond the termination point of the prior impulse wave, Fibonacci retracements can begin from either the orthodox peak, in this case SPX 2872, or the actual peak of 2940. The SPX bottomed six points below a Fib .236 retrace of the move from SPX 666 to 2872. To view a smaller version of a combination wave correction please examine the SPX from April to June 2016. If the 2346 SPX bottom holds, a future article will have a detailed examination of the supposed combination wave. The most significant evidence that the SPX may have bottomed or will soon are the extremely high Put/Call readings made on December 20 and 21. Except for readings in February 2010, the late December 2018 readings were higher than any other time in the Bull market from 2009. Backing up the evidence from the Put/Call ratio is a very oversold weekly stochastic reading. The late December 2018 levels are the lowest since the 2012 and 2016 corrections that corresponded with significant SPX bottoms. |
|
| Figure 3. The most significant evidence that the SPX may have bottomed or will soon are the extremely high Put/Call readings made on December 20 and 21. |
| Graphic provided by: tradingview.com. |
| |
| The Plan for Early 2019 The extremely high bearish sentiment and oversold momentum could be a signal that the bull market from 2009 to 2018 is complete and a bear market lasting several years has begun. If so, typically after the first phase of a stock bear market the first rally will retrace 60 to 90% of the decline. The 1929 to 1932 bear market is a good example. After the September to November 1929 crash the Dow Jones Industrial Average retraced 60% of the crash before turning down again in April 1930. A low holding for months could be in place late December 2018 or early 2019. Traders should be covering shorts and initiate long positions. If already long continue to hold, there's a high probability higher prices could come soon. Very short term if the SPX top of 2520 on December 28 holds, the next decline could either test the bottom at 2346 or reach Fibonacci support near 2280. Time forecast for a potential bottom is the first or second week January 2019. Wishing a happy and prosperous New Year to everyone! Further Reading: Frost A.J and Robert Prechter (1985) "Elliott Wave Principle", New Classics Library. |
Independent investment advisor, trader and writer. He has written articles for Technical Analysis of Stocks & Commodities, Traders.com Advantage,Futuresmag.com and, Finance Magnates. Author of website Four Dimension Trading.
| Website: | www.fourdimensiontrading.com |
| E-mail address: | markrivest@gmail.com |
Click here for more information about our publications!
Comments

Request Information From Our Sponsors
- StockCharts.com, Inc.
- Candle Patterns
- Candlestick Charting Explained
- Intermarket Technical Analysis
- John Murphy on Chart Analysis
- John Murphy's Chart Pattern Recognition
- John Murphy's Market Message
- MurphyExplainsMarketAnalysis-Intermarket Analysis
- MurphyExplainsMarketAnalysis-Visual Analysis
- StockCharts.com
- Technical Analysis of the Financial Markets
- The Visual Investor
- VectorVest, Inc.
- Executive Premier Workshop
- One-Day Options Course
- OptionsPro
- Retirement Income Workshop
- Sure-Fire Trading Systems (VectorVest, Inc.)
- Trading as a Business Workshop
- VectorVest 7 EOD
- VectorVest 7 RealTime/IntraDay
- VectorVest AutoTester
- VectorVest Educational Services
- VectorVest OnLine
- VectorVest Options Analyzer
- VectorVest ProGraphics v6.0
- VectorVest ProTrader 7
- VectorVest RealTime Derby Tool
- VectorVest Simulator
- VectorVest Variator
- VectorVest Watchdog