

HOT TOPICS LIST
- MACD
- Fibonacci
- RSI
- Gann
- ADXR
- Stochastics
- Volume
- Triangles
- Futures
- Cycles
- Volatility
- ZIGZAG
- MESA
- Retracement
- Aroon
INDICATORS LIST
LIST OF TOPICS
PRINT THIS ARTICLE
by Mark Rivest
Elliott wave analysis provides important directional clues. The sharp decline of US stocks in December 2018 created doubt about the bull market that began in March 2009. The S&P 500 (SPX) broke below very important support at 2532 and ended December down 9.1%, in a seasonally bullish month. These two factors could be the first signs of a bear market. However, other factors, and the subsequent rally in early 2019, have shifted the probabilities to the bullish side. Within the next few months the SPX could continue upwards and make a new all-time high.
Position: Buy
Mark Rivest
Independent investment advisor, trader and writer. He has written articles for Technical Analysis of Stocks & Commodities, Traders.com Advantage,Futuresmag.com and, Finance Magnates. Author of website Four Dimension Trading.
PRINT THIS ARTICLE
ELLIOTT WAVE
Outlook For US Stocks In 2019
01/31/19 05:01:32 PMby Mark Rivest
Elliott wave analysis provides important directional clues. The sharp decline of US stocks in December 2018 created doubt about the bull market that began in March 2009. The S&P 500 (SPX) broke below very important support at 2532 and ended December down 9.1%, in a seasonally bullish month. These two factors could be the first signs of a bear market. However, other factors, and the subsequent rally in early 2019, have shifted the probabilities to the bullish side. Within the next few months the SPX could continue upwards and make a new all-time high.
Position: Buy
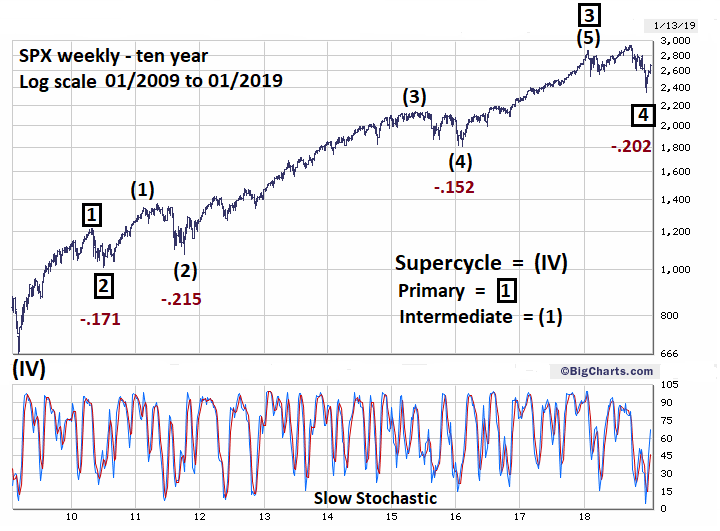
| S&P 500 From 2009 Most Elliott five-wave impulse patterns have one sub-wave extension. In stock markets this typically occurs in the third wave position. Extensions are the longest wave with exaggerated sub divisions. An impulse wave with an extended sub-wave when complete will have a nine-wave count — five rally waves and four corrective waves. Please see the weekly SPX chart illustrated in Figure 1. Each of the four corrections of the bull market (2010, 2011, 2015/2016, and 2018) are roughly about the same size. In a textbook nine-wave pattern the Primary degree corrections are slightly larger than the Intermediate degree. The one deviation of the supposed developing nine-wave pattern occurred with the 2011 correction of 21.5%, as opposed to the 17.1% correction in 2010. This is a rare example of an Intermediate degree correction being larger than the Primary degree correction. It's possible the nine-wave pattern is complete at the SPX September 2018 peak. The brief January/February 2018 drop could be Primary wave "4" and the subsequent rally to new highs could be Primary wave "5". The reasons why this is a low probability alternate wave count are discussed in the following sections. |
|
| Figure 1. Each of the four corrections of the bull market (2010, 2011, 2015/2016, and 2018) are roughly about the same size. |
| Graphic provided by: BigCharts.com. |
| |
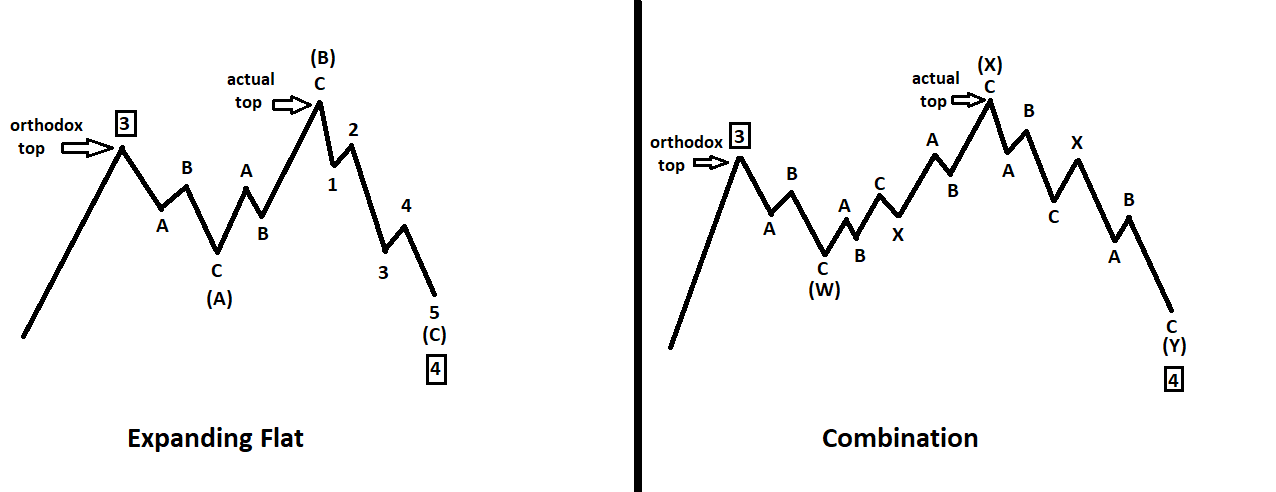
There are three families of Elliott wave corrective patterns: Zigzag, Flat, and Triangle. Within the Flat family there are three sub types: Regular, Expanding, and Running. Expanding Flats appear frequently and are composed of three waves. The first wave 'a' will usually itself subdivide into three waves. The subsequent wave 'b' usually subdivides into three waves and exceeds the wave 'a' point of origin. The final phase subdivides into five waves that exceed the termination point of wave 'a'. Expanding Flats are one of the four situations in which a corrective pattern will exceed the termination point of the prior impulse wave. The other three situations are: Running Flats, Running Triangles and Combinations. When a corrective pattern exceeds an impulse wave termination point it creates two tops/bottom. The Impulse termination is called the orthodox top/bottom. The subsequent correction's high/low is called the actual top/bottom. When there are two tops/bottoms the Fibonacci retracement calculation can be made from either top/bottom. For example, if you wanted to determine where an Expanding Flat correction could terminate — the calculation should be made from both the orthodox and actual top/bottom. Combinations occur when two or more different corrective patterns combine to form a larger degree correction. On rare occasions part of the combination could exceed the termination point of the prior impulse wave. Please see the illustrations of an Expanding Flat and Combination in Figure 2. In this example the Combination consists of a single Zigzag down, followed by a double Zigzag up and completing with a double Zigzag down. It's important to remember that sometimes Combinations can exceed the termination point of the prior impulse wave. An analyst could be expecting the pattern to complete in five waves like the more common Expanding Flat. Then miss a turn because the pattern completed in a single or double Zigzag. To see an example of a Combination exceeding an impulse wave termination, look at an SPX daily bar chart from April 20 to June 27, 2016. |
|
| Figure 2. The Impulse termination is called the orthodox top/bottom. The subsequent correction's high/low is called the actual top/bottom. |
| Graphic provided by: Mark Rivest. |
| |
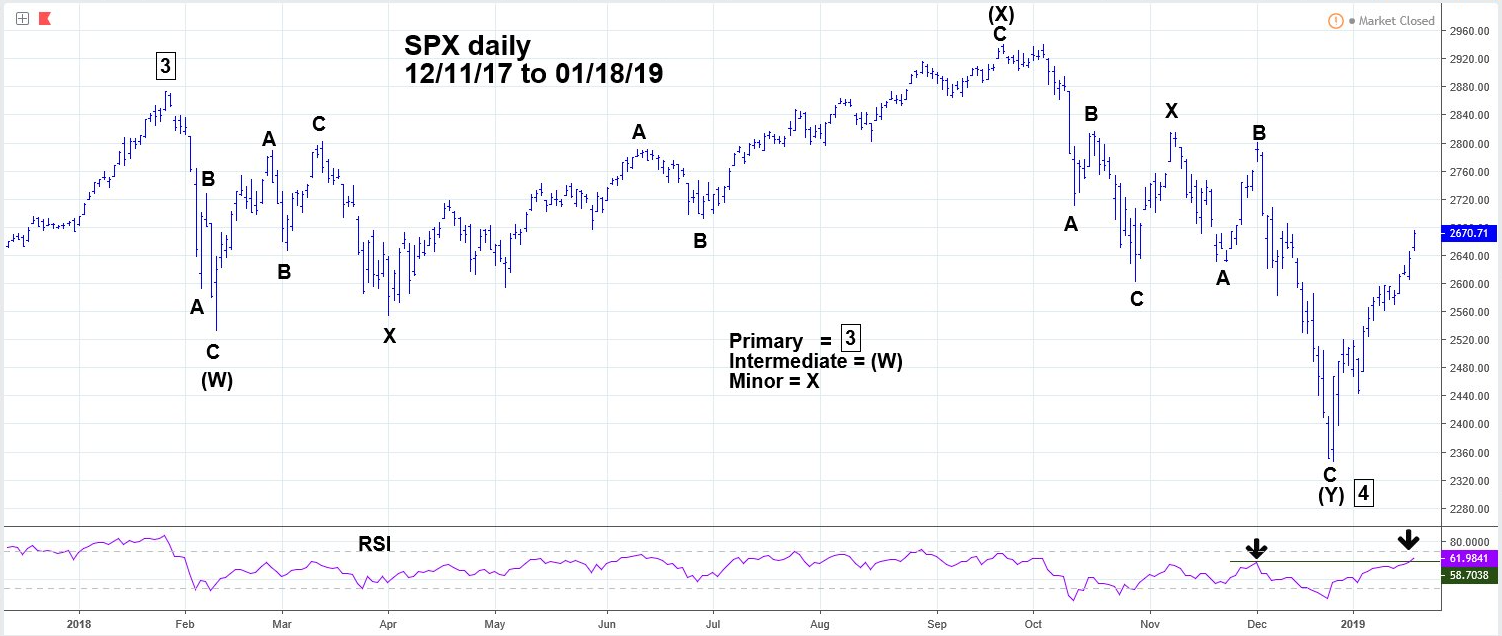
Please see the SPX daily chart illustrated in Figure 3. The SPX rally from the micro crash bottom in February to its September all-time high was very choppy and does not resemble either an impulse wave or an Ending Diagonal Triangle. In several of my 2018 articles I noted that the SPX decline from January may have formed an Elliott wave Horizontal Triangle that terminated at 2594.62 on May 3. Even the rally from early May to September does not count as a completed five waves. The choppy February to September rally is the first clue that the price action from the January peak is a correction within an ongoing bull market. The next clue is the September to December decline, which also does not appear to be an impulse wave. Finally, and most importantly as noted in my January 3 article, "Death of a Bull Market?", the December 26 SPX bottom was 2346.58. This is just six points below a .236 Fibonacci retracement of the bull market from SPX 666.79 to the January 2018 high of 2872.87. The calculated retracement level from the lower 2018 SPX peak is a powerful clue that the entire price action from the January high to the December bottom could be a Combination correction. |
|
| Figure 3. The choppy February to September rally is the first clue that the price action from the January peak is a correction within an ongoing bull market. |
| Graphic provided by: tradingview.com. |
| |
In December 2018 there were strong signals from each of the four market dimensions: Time dimension: US stock market down in a seasonally bullish month — signal bearish. Sentiment dimension: Put/Call ratio on December 20 had highest reading in years — signal bullish. Momentum dimension: Most oversold weekly Stochastic reading in several years — signal bullish. Price dimension: SPX bottom at 2346.58 is near a very important Fibonacci support level — signal bullish. One bearish signal and three bullish signals imply a multi-month rally could be underway. Subsequent to the December 26 bottom, the weekly Slow Stochastic has climbed to the neutral zone, implying higher prices. The daily RSI on January 18 reached 61%, which is above the reading of 58% made on December 3 when the SPX was at 2800. This signal implies the SPX could reach at least 2800. If a Primary degree wave '4' is complete at the December 26 bottom, the subsequent rally is probably Primary degree '5'. Target for top of this wave and possibly the termination point of the entire bull market is SPX 3047 — first discussed in my February 1, 2018 article "How High is Up?" Time target for this possible peak is sometime in March 2019 — the ten-year anniversary of the bull market. Further Reading: Frost A.J and Robert Prechter (1985) "Elliott Wave Principle", New Classics Library. |
Independent investment advisor, trader and writer. He has written articles for Technical Analysis of Stocks & Commodities, Traders.com Advantage,Futuresmag.com and, Finance Magnates. Author of website Four Dimension Trading.
| Website: | www.fourdimensiontrading.com |
| E-mail address: | markrivest@gmail.com |
Click here for more information about our publications!
Comments
Date:�02/01/19Rank:�5Comment:�

Request Information From Our Sponsors
- VectorVest, Inc.
- Executive Premier Workshop
- One-Day Options Course
- OptionsPro
- Retirement Income Workshop
- Sure-Fire Trading Systems (VectorVest, Inc.)
- Trading as a Business Workshop
- VectorVest 7 EOD
- VectorVest 7 RealTime/IntraDay
- VectorVest AutoTester
- VectorVest Educational Services
- VectorVest OnLine
- VectorVest Options Analyzer
- VectorVest ProGraphics v6.0
- VectorVest ProTrader 7
- VectorVest RealTime Derby Tool
- VectorVest Simulator
- VectorVest Variator
- VectorVest Watchdog
- StockCharts.com, Inc.
- Candle Patterns
- Candlestick Charting Explained
- Intermarket Technical Analysis
- John Murphy on Chart Analysis
- John Murphy's Chart Pattern Recognition
- John Murphy's Market Message
- MurphyExplainsMarketAnalysis-Intermarket Analysis
- MurphyExplainsMarketAnalysis-Visual Analysis
- StockCharts.com
- Technical Analysis of the Financial Markets
- The Visual Investor