

HOT TOPICS LIST
- MACD
- Fibonacci
- RSI
- Gann
- ADXR
- Stochastics
- Volume
- Triangles
- Futures
- Cycles
- Volatility
- ZIGZAG
- MESA
- Retracement
- Aroon
INDICATORS LIST
LIST OF TOPICS
PRINT THIS ARTICLE
by Mark Rivest
See how sentiment and momentum indicators can confirm a trend.
Position: N/A
Mark Rivest
Independent investment advisor, trader and writer. He has written articles for Technical Analysis of Stocks & Commodities, Traders.com Advantage,Futuresmag.com and, Finance Magnates. Author of website Four Dimension Trading.
PRINT THIS ARTICLE
ELLIOTT WAVE
Elliott Wave Interpretations - Part Two
11/30/18 04:02:44 PMby Mark Rivest
See how sentiment and momentum indicators can confirm a trend.
Position: N/A
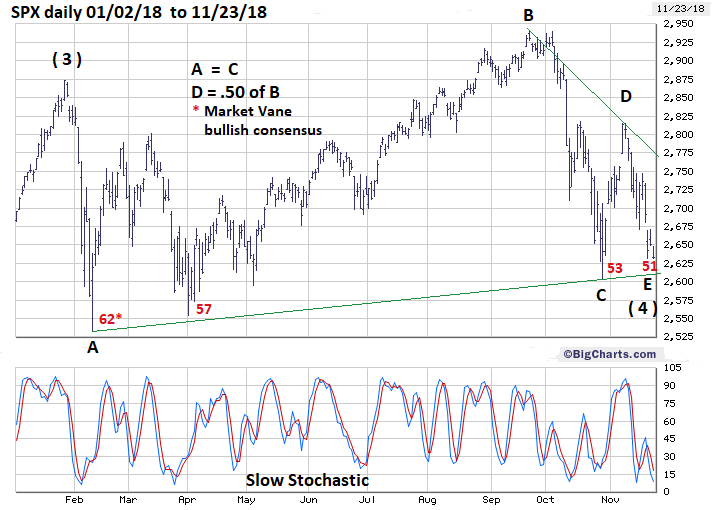
| Near the end of October 2018, it appeared the S&P 500 (SPX) had a choice of two bullish Elliott wave counts. As November ends, the SPX may have settled on the path to higher prices. The sideways trend from January to November has the distinctive look of an Elliott wave Horizontal Triangle. Price Dimension My November 8 article "Elliott Wave Interpretations" noted that the most likely Elliott wave patterns since the SPX January 2018 peak were either a Horizontal Triangle or an Ending Diagonal Triangle. Fibonacci analysis indicates a Horizontal Triangle has probably been developing since the SPX January 26 peak. Please see the SPX daily chart illustrated in Figure 1. The lengths of the five sub waves are: A = 340.18, B = 408.22, C = 337.30, D = 211.61, E - as of November 23 = 184.06. Most Horizontal Triangles contract from there point of origin. However, sometimes wave "B" will exceed the start of wave "A", these are referred to as "Running Triangles". The January to November SPX movement appears to be this type. The most likely Fibonacci relationship between waves "A" and "B" in a Running Triangle is 1.236. In this case, wave "B" 408.22 / "A" 340.18 = 1.20. Wave "A" and "C" usually have a Fibonacci relationship; in this case, it's equality — Wave "C" 337.37 / "A 340.18 = .991. The relationship of wave "D" 211.61 / "B" 408.22 = .518 very close to .50. As of November 23, there is no Fibonacci relationship between wave "E" and any of the sub waves. However, if wave "E" has terminated at 2631.09 on November 23 it could be a very important coordinate forecasting the next SPX all-time high. After completion of a Horizontal Triangle, markets continue the primary trend, which in this case is up. Many times, the widest part of a Horizontal Triangle added or subtracted from the triangle's termination point can forecast the length of the subsequent move. The widest part of the SPX 2018 Horizontal triangle is 408.22 points, added to the supposed wave "E" termination point of SPX 2631.09 targets 3039.31, which is very close to SPX 3047.98 — major Fibonacci resistance noted in my February 1, 2018 article "How High is Up?". |
|
| Figure 1. A Horizontal Triangle has probably been developing since the SPX January 26 peak. |
| Graphic provided by: BigCharts.com. |
| |
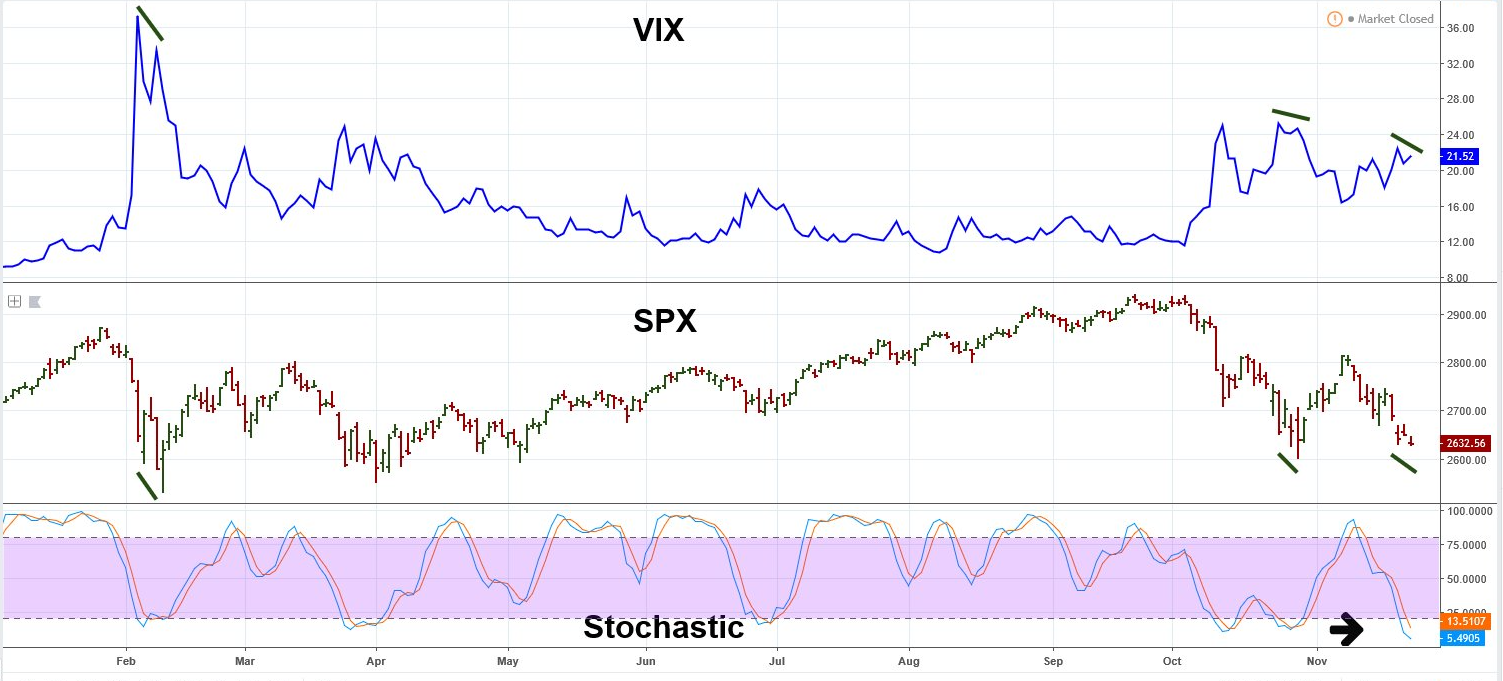
| Sentiment And Momentum Dimensions Please see the daily VIX and SPX chart illustrated in Figure 2. For what could be the third time this year the daily VIX has a small divergence vs. the peak it made a few days before. If this most recent divergence holds, it's probably signaling an SPX rally. In February, the SPX lower low corresponded with a VIX lower top indicating a lessening of fear. The result was an immediate SPX rally; the same happened in late October. If the current signal holds the SPX could start a new rally as soon as November 26. The Market Vane bullish consensus numbers shown in Figure 1, when combined with an Elliott wave Horizontal Triangle, have a very interesting interpretation. Market Vane, Inc. bullish consensus is compiled by tracking the buy and sell recommendations of leading market advisers and commodity trading advisers relative to various markets. Very high readings usually correspond to tops, very low readings to bottoms. Divergent readings, like those on the VIX are typically very reliable signals. Since the February 2018 SPX bottom, price has been rising while the bullish consensus numbers decrease. Advisors are getting more bearish as the SPX moves up. This is the opposite of what normally happens. It is, however, unique to Elliott wave Horizontal Triangles that are correcting the progress of bullish trends. The ideal sentiment for a Horizontal Triangle in a rising market is for wave "C" to have greater bearish sentiment than wave "A" and for wave "E" to have greater bearish sentiment than wave "C". However, there's another interpretation to this phenomenon — it could be a warning sign of coming lower prices. If the supposed wave "C" low at SPX 2603 is broken it could be a caution sign that something more bearish is developing. If the supposed wave "A" SPX bottom at 2532 is breached it could be the prelude to a very sharp and deep decline. Weekly Stochastic has reached the oversold zone implying a multi-week rally could be imminent. |
|
| Figure 2. In February, the SPX lower low corresponded with a VIX lower top indicating a lessening of fear. |
| Graphic provided by: tradingview.com. |
| |
| Summary The combination of Fibonacci analysis, sentiment and momentum readings in late November 2018 indicate that the SPX could be on the verge of a rally lasting until at least January 2019. Elliott wave patterns are famous for anticipating future moves. What is less known — the best Elliott analysis comes when the forecast is proven wrong. If the supposed Horizontal wave "C" bottom at SPX 2603 is broken it could be a signal of lower prices. A break below the supposed wave "A" at SPX 2532 could be extremely bearish. Great traders have the greatest mental flexibility, they don't get married to a position or a forecast. If the market changes its opinion you need to be ready to change your opinion, and sometimes that change needs to come fast. Further Reading: Frost A.J and Robert Prechter (1985) "Elliott Wave Principle", New Classics Library. Hadady R. Earl (1983) "Contrary Opinion", Key Books. |
Independent investment advisor, trader and writer. He has written articles for Technical Analysis of Stocks & Commodities, Traders.com Advantage,Futuresmag.com and, Finance Magnates. Author of website Four Dimension Trading.
| Website: | www.fourdimensiontrading.com |
| E-mail address: | markrivest@gmail.com |
Click here for more information about our publications!
Comments
Date:�12/08/18Rank:�3Comment:�

Request Information From Our Sponsors
- VectorVest, Inc.
- Executive Premier Workshop
- One-Day Options Course
- OptionsPro
- Retirement Income Workshop
- Sure-Fire Trading Systems (VectorVest, Inc.)
- Trading as a Business Workshop
- VectorVest 7 EOD
- VectorVest 7 RealTime/IntraDay
- VectorVest AutoTester
- VectorVest Educational Services
- VectorVest OnLine
- VectorVest Options Analyzer
- VectorVest ProGraphics v6.0
- VectorVest ProTrader 7
- VectorVest RealTime Derby Tool
- VectorVest Simulator
- VectorVest Variator
- VectorVest Watchdog
- StockCharts.com, Inc.
- Candle Patterns
- Candlestick Charting Explained
- Intermarket Technical Analysis
- John Murphy on Chart Analysis
- John Murphy's Chart Pattern Recognition
- John Murphy's Market Message
- MurphyExplainsMarketAnalysis-Intermarket Analysis
- MurphyExplainsMarketAnalysis-Visual Analysis
- StockCharts.com
- Technical Analysis of the Financial Markets
- The Visual Investor