HOT TOPICS LIST
- MACD
- Fibonacci
- RSI
- Gann
- ADXR
- Stochastics
- Volume
- Triangles
- Futures
- Cycles
- Volatility
- ZIGZAG
- MESA
- Retracement
- Aroon
INDICATORS LIST
LIST OF TOPICS
PRINT THIS ARTICLE
by Matt Blackman
The markets are caught in a holding pattern at current levels and evidence is growing that they will head lower. The question is how far could they drop?
Position: N/A
Matt Blackman
Matt Blackman is a full-time technical and financial writer and trader. He produces corporate and financial newsletters, and assists clients in getting published in the mainstream media. He is the host of TradeSystemGuru.com. Matt has earned the Chartered Market Technician (CMT) designation. Find out what stocks and futures Matt is watching on Twitter at www.twitter.com/RatioTrade
PRINT THIS ARTICLE
CHART ANALYSIS
Bearish Rising Wedges Abound
12/05/02 12:09:21 PMby Matt Blackman
The markets are caught in a holding pattern at current levels and evidence is growing that they will head lower. The question is how far could they drop?
Position: N/A
| I was interested to read Gary Grosschadl's article entitled, Bearish Rising Wedge Spells Danger (Traders.com Advantage, 12/02/02), regarding JDS Uniphase (JDSU). The previous night I had been scanning the charts and noticed that this pattern was prevalent in each one of the indexes I examined. After reading Gary's article, I also checked Nortel Networks (NT.TO) and noticed that it too was exhibiting a rising wedge, although the volume was somewhat choppy. |
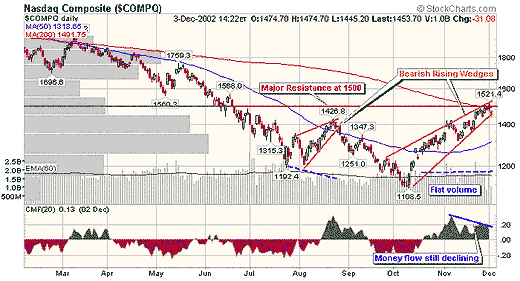
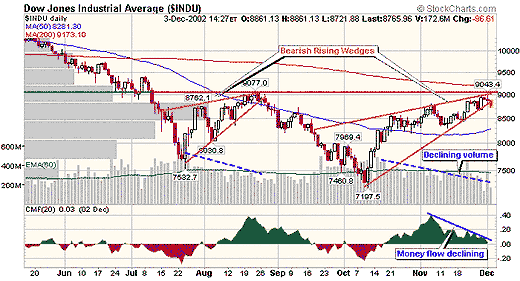
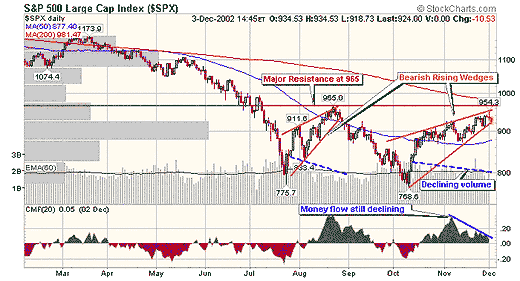
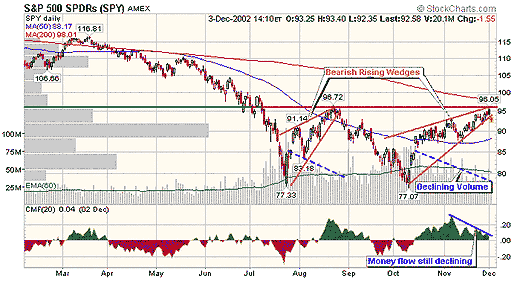
| A classic wedge formation signals a pause before the security resumes moving in the direction of the dominant trend. Normally the tip of the wedge points in the opposite direction of the trend. If the dominant trend is up, the wedge points downward. In this case, the dominant market direction prior to the wedge was down, hence the rising wedge pattern. Another quality is that volume generally declines as the wedge progresses. This article is as much a heads up on the markets as it is an update of two past articles. In Rally Showing Signs of Fatigue (Traders.com Advantage, 11/27/02) and The Critical Head & Shoulders Test (Working Money, 11/12/02) I discussed a number of technical signs that are challenging this latest rally and question whether it is sustainable or not. The Nasdaq Composite, the Dow Industrial Average, the S&P 500 and the S&P SPDRS indexes still have to break through major head & shoulders neckline resistance levels that will be necessary to call the latest rally a true bottom recovery. All charts below show the necklines as major resistance levels. It is also interesting to note that all four indexes demonstrated similar rising wedges in the previous bear rally (July-August 2002). |

|
| Figure 1 – Daily Nasdaq Composite index. The one caveat to the latest rising wedge is the apparent lack in declining volume. |
| Graphic provided by: StockCharts.com. |
| |
 Figure 2 - Dow Jones Industrial Average with rising wedges, declining volume and money flow.  Figure 3 - Standard & Poor's 500 index with rising wedges, declining volume and money flow.  Figure 4 - Standard & Poor's SPDRs showing the same classic patterns as the first three indexes. |
| Market direction is important to all investors because markets determine 80% of the movement in individual stocks. It is going to take some sustained good economic, geopolitical and earnings news to propel markets above major resistance levels and keep them there. If this fails to occur, look for markets to continue bouncing off these levels, eventually resuming their bear march to lower levels. The technicals appear to be pointing in the latter direction. It is also interesting to note that some of the investor optimism has evaporated in the last few trading sessions and negative news is now having a greater impact. Could this signal the beginning of a return to bearish sentiment and lend more support to the premise that the latest run-up is just another bear rally? |
Matt Blackman is a full-time technical and financial writer and trader. He produces corporate and financial newsletters, and assists clients in getting published in the mainstream media. He is the host of TradeSystemGuru.com. Matt has earned the Chartered Market Technician (CMT) designation. Find out what stocks and futures Matt is watching on Twitter at www.twitter.com/RatioTrade
| Company: | TradeSystemGuru.com |
| Address: | Box 2589 |
| Garibaldi Highlands, BC Canada | |
| Phone # for sales: | 604-898-9069 |
| Fax: | 604-898-9069 |
| Website: | www.tradesystemguru.com |
| E-mail address: | indextradermb@gmail.com |
Traders' Resource Links | |
| TradeSystemGuru.com has not added any product or service information to TRADERS' RESOURCE. | |
Click here for more information about our publications!
Comments
Date: 12/05/02Rank: 3Comment: don t agree
Date: 12/05/02Rank: 4Comment:
Date: 12/05/02Rank: 5Comment:
Date: 12/06/02Rank: 5Comment:
Date: 12/10/02Rank: 4Comment:
Date: 04/29/03Rank: 4Comment:

Request Information From Our Sponsors
- StockCharts.com, Inc.
- Candle Patterns
- Candlestick Charting Explained
- Intermarket Technical Analysis
- John Murphy on Chart Analysis
- John Murphy's Chart Pattern Recognition
- John Murphy's Market Message
- MurphyExplainsMarketAnalysis-Intermarket Analysis
- MurphyExplainsMarketAnalysis-Visual Analysis
- StockCharts.com
- Technical Analysis of the Financial Markets
- The Visual Investor
- VectorVest, Inc.
- Executive Premier Workshop
- One-Day Options Course
- OptionsPro
- Retirement Income Workshop
- Sure-Fire Trading Systems (VectorVest, Inc.)
- Trading as a Business Workshop
- VectorVest 7 EOD
- VectorVest 7 RealTime/IntraDay
- VectorVest AutoTester
- VectorVest Educational Services
- VectorVest OnLine
- VectorVest Options Analyzer
- VectorVest ProGraphics v6.0
- VectorVest ProTrader 7
- VectorVest RealTime Derby Tool
- VectorVest Simulator
- VectorVest Variator
- VectorVest Watchdog
