HOT TOPICS LIST
- MACD
- Fibonacci
- RSI
- Gann
- ADXR
- Stochastics
- Volume
- Triangles
- Futures
- Cycles
- Volatility
- ZIGZAG
- MESA
- Retracement
- Aroon
INDICATORS LIST
LIST OF TOPICS
PRINT THIS ARTICLE
by Matt Blackman
As this rally moves into the third month, it is beginning to show its age. Is it simply taking a breather, or is it running out of gas?
Position: N/A
Matt Blackman
Matt Blackman is a full-time technical and financial writer and trader. He produces corporate and financial newsletters, and assists clients in getting published in the mainstream media. He is the host of TradeSystemGuru.com. Matt has earned the Chartered Market Technician (CMT) designation. Find out what stocks and futures Matt is watching on Twitter at www.twitter.com/RatioTrade
PRINT THIS ARTICLE
MONEY FLOW INDEX
Rally Showing Signs of Fatigue
11/27/02 12:20:51 PMby Matt Blackman
As this rally moves into the third month, it is beginning to show its age. Is it simply taking a breather, or is it running out of gas?
Position: N/A
| A number of major market indexes, including the Dow Jones Industrial Average ($INDU), the Standard & Poor's 500 ($SPX), the Nasdaq 100 ($COMPQ) and the Standard & Poor's Depositary Receipts (SPY) indexes, are all in agreement. They are showing the markets to be overbought and getting ready to take a rest. It has been more than seven weeks of excitement as investors jumped back in, driving the indexes toward and in some cases past the highs set in August, but it now remains to be seen if they have the momentum necessary to break the major resistance levels to call this a recovery. It is safe to say that they will be taking a rest before we will know the answer. |
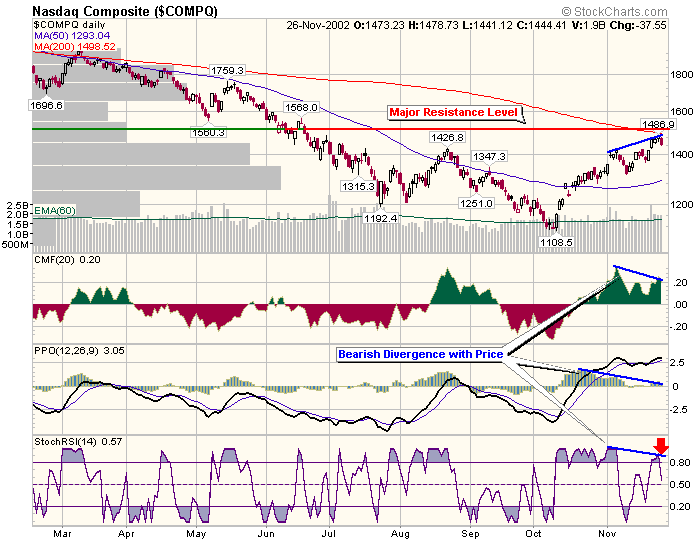
 Figure 1 - Daily chart of the Nasdaq 100 ($COMPQ) showing divergence between price and momentum indicators. As the Nasdaq heads for its major resistance level of 1500, there are signs that it is running out of steam, at least in the near-term. There is a definite bearish divergence between price and the Chaikin money flow (CMF), percentage price oscillator histogram (PPO), and the stochastic relative strength index. In addition, the stochastic-RSI generated a sell signal on November 26 as it moved out of overbought territory. Similar divergences exist with the S&P500 and SPY. |

|
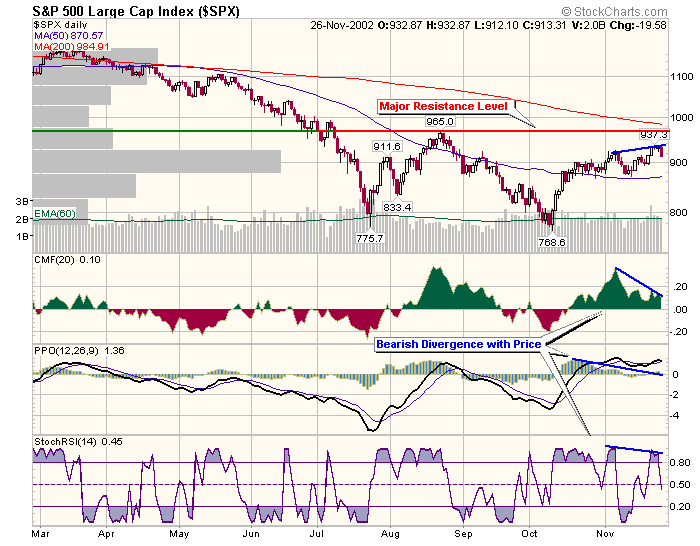
| Figure 2 – Standard & Poor’s 500 index showing negative divergence. Note stochastic-RSI sell signal generated on November 26 as the signal line moved out of overbought territory and headed down on all three charts. |
| Graphic provided by: StockCharts.com. |
| |
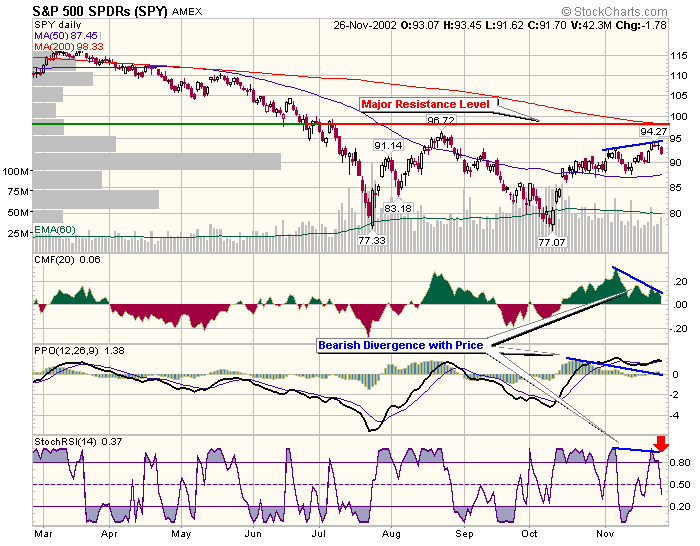
 Figure 3 - Daily chart of the Standard & Poor's SPDRs (SPY) showing negative divergence between momentum indicators, price, and red stochastic-RSI sell signal arrow. |
| It is too early to tell by looking at the weekly charts if money flow will continue to drop longer-term, but it is clear from all three daily charts that money has been leaving the markets since the first week in November. It appears to be an excellent time for those of you who have been riding this rally up to take some money off the table. While the latest economic numbers have been positive, fourth quarter earnings season is quickly approaching, and it will take sustainable positive earnings and continued good news about the economy and consumer spending to keep investor optimism and the latest market drive alive. A number of technology stocks appear to be riding on little more than investor optimism, and we could see a number of them correct significantly in the next few trading sessions if there are any bumps in the road ahead. |
Matt Blackman is a full-time technical and financial writer and trader. He produces corporate and financial newsletters, and assists clients in getting published in the mainstream media. He is the host of TradeSystemGuru.com. Matt has earned the Chartered Market Technician (CMT) designation. Find out what stocks and futures Matt is watching on Twitter at www.twitter.com/RatioTrade
| Company: | TradeSystemGuru.com |
| Address: | Box 2589 |
| Garibaldi Highlands, BC Canada | |
| Phone # for sales: | 604-898-9069 |
| Fax: | 604-898-9069 |
| Website: | www.tradesystemguru.com |
| E-mail address: | indextradermb@gmail.com |
Traders' Resource Links | |
| TradeSystemGuru.com has not added any product or service information to TRADERS' RESOURCE. | |
Click here for more information about our publications!
Comments
Date: 11/28/02Rank: 5Comment:
Date: 11/29/02Rank: 5Comment: Has the strong market this past week changed the readings/correlations? Isn t monet still going to move into equities from bonds?
Date: 11/29/02Rank: 5Comment: Has the strong market this past week changed the readings/correlations? Isn t monet still going to move into equities from bonds?
Date: 11/30/02Rank: 5Comment:
Date: 11/30/02Rank: 2Comment:
Date: 12/01/02Rank: 5Comment: good
Date: 12/03/02Rank: 5Comment:
Date: 12/04/02Rank: 5Comment:
Date: 12/06/02Rank: 5Comment:
Date: 12/08/02Rank: 5Comment:
Date: 12/08/02Rank: 5Comment:
Date: 12/09/02Rank: 3Comment:

Request Information From Our Sponsors
- StockCharts.com, Inc.
- Candle Patterns
- Candlestick Charting Explained
- Intermarket Technical Analysis
- John Murphy on Chart Analysis
- John Murphy's Chart Pattern Recognition
- John Murphy's Market Message
- MurphyExplainsMarketAnalysis-Intermarket Analysis
- MurphyExplainsMarketAnalysis-Visual Analysis
- StockCharts.com
- Technical Analysis of the Financial Markets
- The Visual Investor
- VectorVest, Inc.
- Executive Premier Workshop
- One-Day Options Course
- OptionsPro
- Retirement Income Workshop
- Sure-Fire Trading Systems (VectorVest, Inc.)
- Trading as a Business Workshop
- VectorVest 7 EOD
- VectorVest 7 RealTime/IntraDay
- VectorVest AutoTester
- VectorVest Educational Services
- VectorVest OnLine
- VectorVest Options Analyzer
- VectorVest ProGraphics v6.0
- VectorVest ProTrader 7
- VectorVest RealTime Derby Tool
- VectorVest Simulator
- VectorVest Variator
- VectorVest Watchdog
