

HOT TOPICS LIST
- MACD
- Fibonacci
- RSI
- Gann
- ADXR
- Stochastics
- Volume
- Triangles
- Futures
- Cycles
- Volatility
- ZIGZAG
- MESA
- Retracement
- Aroon
INDICATORS LIST
LIST OF TOPICS
PRINT THIS ARTICLE
by Gary Grosschadl
This Canadian telecom play also trades on Nasdaq (JDSU). Several negatives point to likely downside making this a poor prospect for shorter term traders holding long positions.
Position: Sell
Gary Grosschadl
Independent Canadian equities trader and technical analyst based in Peterborough
Ontario, Canada.
PRINT THIS ARTICLE
CHART ANALYSIS
Bearish Rising Wedge Spells Danger
12/02/02 10:27:34 AMby Gary Grosschadl
This Canadian telecom play also trades on Nasdaq (JDSU). Several negatives point to likely downside making this a poor prospect for shorter term traders holding long positions.
Position: Sell
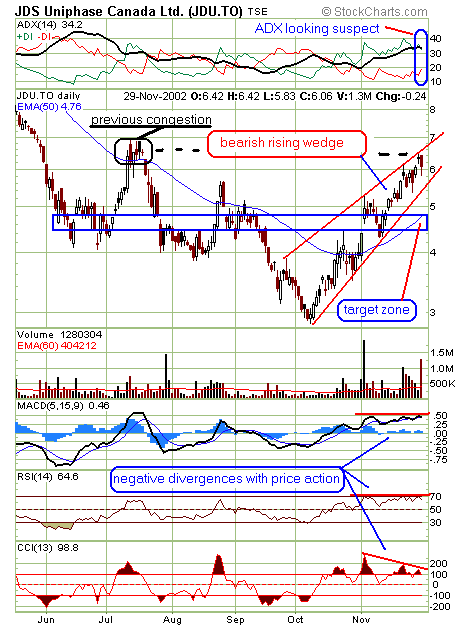
| JDS Uniphase (CA:JDU) has doubled in price since its surge from $3. As the chart shows, it has been rising in a bearish wedge formation, so traders should be wary of possible reversals. Now several negative divergences to price action have shown up via the displayed indicators MACD, RSI and CCI, making it difficult to keep any bullish bias. |
| JDU has also reached the same congestion zone, that had formed last summer. This could act as significant resistance. Also note the doji candle (a small cross) from two days ago (11/27/02). A doji after a significant rise often acts as a turning point. Friday's bearish candle confirms this negative implication for now. The stock has been rising lately on diminshing volume (another negative divergence), also a sign of weakness. Friday's bearish action came with a large volume spike --despite the shortened trading day for American traders-- which is a warning of possibly more downside action coming. |
|
| Graphic provided by: StockCharts.com. |
| |
| Another concern is the directional movement, or trend strength indicator, on the above chart. The DIs are starting to converge, which is bearish and the black ADX line may have peaked. If the DIs continue to converge they may cross, adding weight to the probable decline. |
| Should the stock violate the trendline at the 5.50 area, the implication of the rising wedge pattern may lead to a sizeable decline to the target zone as drawn. This area between 4.50 - 4.75 represents several previous gap areas, the 50-day EMA line and the measured wedge decline. However psychological support at the $5 area could also come into play as another reversal so traders should also watch this level. A surprise move to the upside breaking past the upper trendline on high volume negates the bearish implication of the rising wedge, but this seems unlikely. |
| Aggressive traders may target any weakness below $6 but JDU must also close below that level. Ideally, shorters want to see that trendline violation of 5.50 on very large volume to add zest to the decline. |
Independent Canadian equities trader and technical analyst based in Peterborough
Ontario, Canada.
| Website: | www.whatsonsale.ca/financial.html |
| E-mail address: | gwg7@sympatico.ca |
Click here for more information about our publications!
Comments
Date:�12/05/02Rank:�5Comment:�good call

Request Information From Our Sponsors
- StockCharts.com, Inc.
- Candle Patterns
- Candlestick Charting Explained
- Intermarket Technical Analysis
- John Murphy on Chart Analysis
- John Murphy's Chart Pattern Recognition
- John Murphy's Market Message
- MurphyExplainsMarketAnalysis-Intermarket Analysis
- MurphyExplainsMarketAnalysis-Visual Analysis
- StockCharts.com
- Technical Analysis of the Financial Markets
- The Visual Investor
- VectorVest, Inc.
- Executive Premier Workshop
- One-Day Options Course
- OptionsPro
- Retirement Income Workshop
- Sure-Fire Trading Systems (VectorVest, Inc.)
- Trading as a Business Workshop
- VectorVest 7 EOD
- VectorVest 7 RealTime/IntraDay
- VectorVest AutoTester
- VectorVest Educational Services
- VectorVest OnLine
- VectorVest Options Analyzer
- VectorVest ProGraphics v6.0
- VectorVest ProTrader 7
- VectorVest RealTime Derby Tool
- VectorVest Simulator
- VectorVest Variator
- VectorVest Watchdog