

HOT TOPICS LIST
- MACD
- Fibonacci
- RSI
- Gann
- ADXR
- Stochastics
- Volume
- Triangles
- Futures
- Cycles
- Volatility
- ZIGZAG
- MESA
- Retracement
- Aroon
INDICATORS LIST
LIST OF TOPICS
PRINT THIS ARTICLE
by Mark Rivest
See why interest rates could rise in the new year.
Position: N/A
Mark Rivest
Independent investment advisor, trader and writer. He has written articles for Technical Analysis of Stocks & Commodities, Traders.com Advantage,Futuresmag.com and, Finance Magnates. Author of website Four Dimension Trading.
PRINT THIS ARTICLE
BULL/BEAR MARKET
The Prospect For Higher Interest Rates in 2017
01/25/17 04:52:09 PMby Mark Rivest
See why interest rates could rise in the new year.
Position: N/A
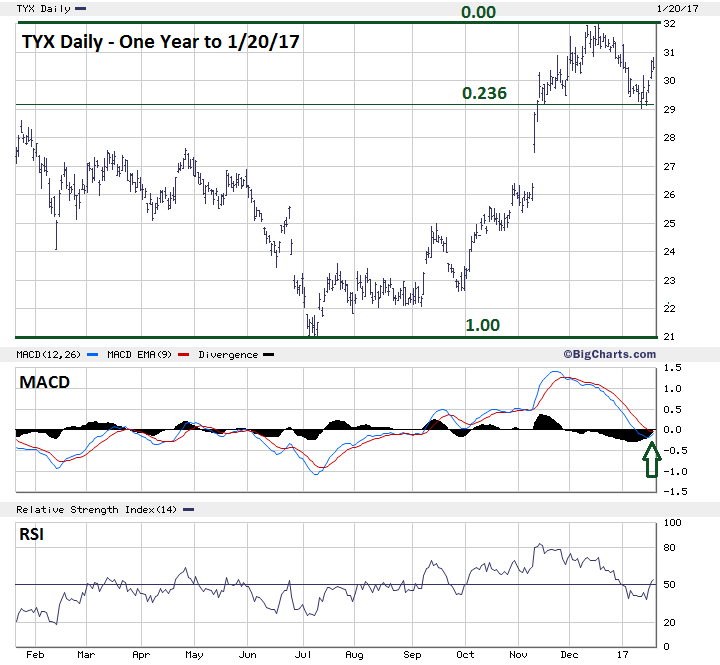
| US Treasury Bond yield (TYX) made an all-time low in early July 2016, then climbed for the next five months topping in mid- December. TYX then declined for nearly a month. Is this a resumption of the multi-decade bear market for interest rates or just a pause in a new bull market? Evidence from all four market dimensions strongly suggests a new multi-month rally may have already begun. US Treasury Bond Yield My last article "The Prospect for Higher Interest Rates and Inflation" examined the long-term evidence that a multi-decade interest rate bull market may have begun in 2016. This current article drills down to examine evidence that indicates interest rates could continue climbing into at least mid-2017. Please see the Daily TYX chart illustrated in Figure 1. Time Dimension: The more than thirty-four-year secular bear market for TYX had ten failed rallies, which is illustrated in my January 18th article. Of those ten rallies, six lasted from twelve to sixteen months. One lasted twenty-four months. Three lasted five to six months. The rally from July 2016 has, so far, only lasted five months. Probabilities favor the rally to continue to at least July 2017. Price Dimension: In the stock market it's said that bull markets climb a wall of worry, and bear markets slide down the slope of hope. The same could be said about the bond market. The TYX chart represents yield which is the inverse of price. Anyone buying bonds near the all-time low in yields bought bonds at their all-time high and have seen values decline for several months. They're now hoping for a big move up in prices to at least break-even. Markets typically aren't that generous. TYX bottomed just below a Fibonacci .236 retrace of the yield rise from July. If this bottom doesn't hold a .382 retrace would be the next logical low to hold. TYX moving below a .382 retrace would open the door to a decline back to the area of the July bottom. Momentum Dimension: Daily MACD lines are on the verge of a bullish crossover and RSI has climbed above 50%. Sentiment Dimension: Market Vane, Inc. conducts polling of futures traders' bullish/bearish opinions to determine bullish consensus numbers for markets. A very high percentage indicate excessive bullishness, while very low percentages indicate excessive bearishness. Trend changes are likely to occur at the extremes. The recent reading for the US Treasury Bond futures market is 64%. The lowest reading since the bond decline in mid-December was only 58%, which is a neutral reading. Considering the steep five-week decline it's surprising the readings aren't lower. This is a sign of complacency and implies lower bond prices/higher yields soon. |
|
| Figure 1. Daily MACD lines are on the verge of a bullish crossover and RSI has climbed above 50%. |
| Graphic provided by: BigCharts.com. |
| |
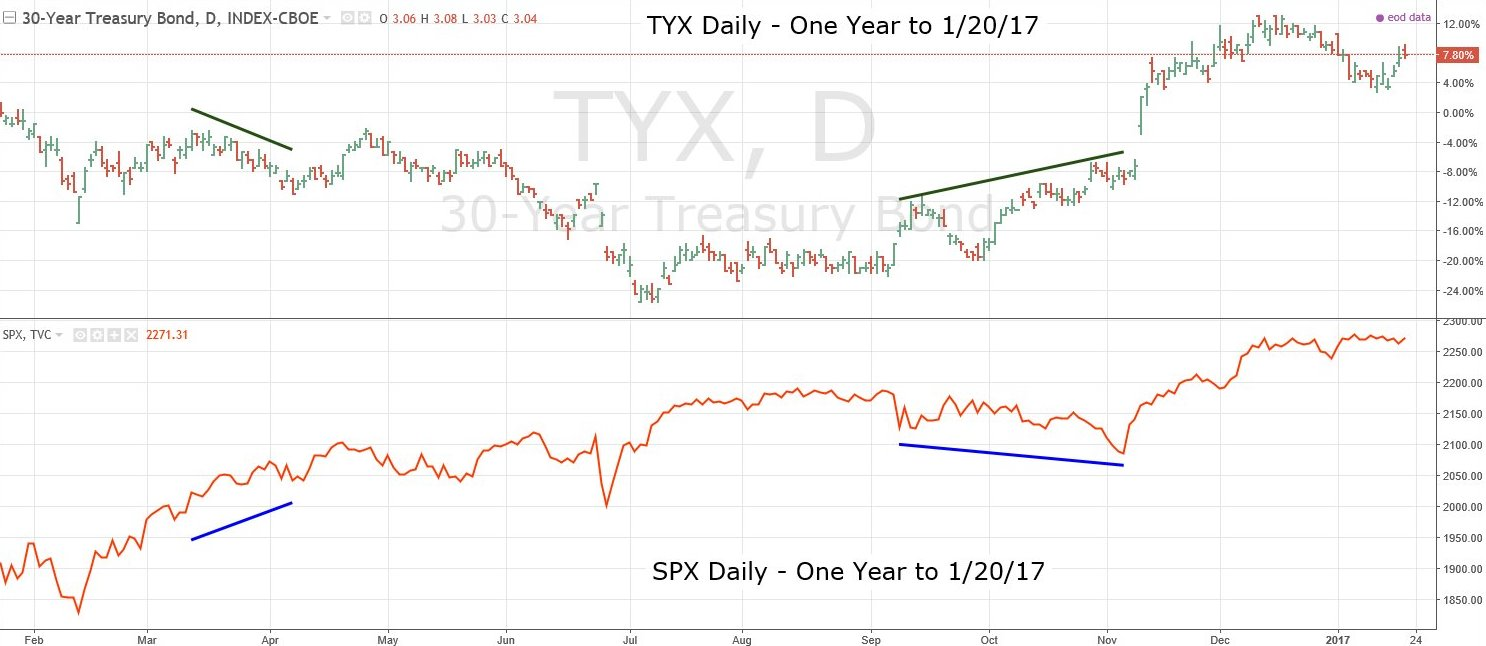
| Stocks Vs. Bonds There's a common misconception that when the stock market rises the bond market declines. If this were true, then because bond yields rise as bond prices decline, stock market prices should trend with bond yields. US Treasury Bond Yield (TYX) was 15.21 at the all-time high in October 1981. TYX reached its all-time low of 2.10 in July 2016. The S&P 500 (SPX) was 115.00 in October 1981 and 2132.00 in July 2016. Stock prices and bond yields generally move in opposite directions, therefore stock and bond prices will generally move in the same direction. "Generally" is the key word because there are times where stock and bond prices diverge, as do stock prices and bond yields. Please see the daily TYX/SPX chart illustrated in Figure 2. What's fascinating about this chart is that from early July 2016 stock prices and bond yields have moved in the same direction. Does this mean that the theory that rising stocks equals declining bonds is about to come true? Doubtful — five months of trending together vs. thirty-four years of trending apart is more likely a divergence from the general trend. Bond yields and stock prices could be heading for a big break up very soon. Evidence from all four market dimensions indicate the rise in yields will likely continue for several months. As for the stock market, its condition has gotten even more bearish. |
|
| Figure 2. Bond yields and stock prices could be heading for a big break up very soon. |
| Graphic provided by: tradingview.com. |
| |
| Stock Market Update My January 11th article "Dow 20,000-The Elusive Nirvana" noted that on January 6th all three main US stock indices made new highs. Typically, significant US stock market peaks have at least one of the main indexes not confirm the high. On January 13th, the Nasdaq Composite made an all-time high unconfirmed by the other two main indices, however the Nasdaq Composite high was confirmed by a secondary index, the Nasdaq 100 (NDX). On January 20th NDX made an all-time high unconfirmed by all three main US stock indices and all the secondary US stock indices. Only one of the nine S&P 500 sector ETF's, Technology (XLF), confirmed the NDX high. This extraordinary non-confirmation in such a short period dramatically illustrates weakness in the US stock bull market. A case could be made that many stocks are already in a bear market and it's just a matter of time before the bear market appears in the indices. That time could be very soon. |
| Summary And Strategy The normal relationship between stocks and bonds is for them to trend together, this could resume very soon with sharp declines in both markets. Interest rate sensitive investments: Sell any bond mutual funds. Unlike bonds, funds have no maturity date. In a rising interest rate environment their share values will fall. Stocks: If the SPX has not traded above 2285.92, short 50% as soon as possible and use SPX 2285.93 as the stop loss. If still holding long positions, this could be the last time to liquidate at the most advantageous prices. Further Reading: Hadady R. Earl (1983) "Contrary Opinion", Key Books. |
Independent investment advisor, trader and writer. He has written articles for Technical Analysis of Stocks & Commodities, Traders.com Advantage,Futuresmag.com and, Finance Magnates. Author of website Four Dimension Trading.
| Website: | www.fourdimensiontrading.com |
| E-mail address: | markrivest@gmail.com |
Click here for more information about our publications!
PRINT THIS ARTICLE

Request Information From Our Sponsors
- VectorVest, Inc.
- Executive Premier Workshop
- One-Day Options Course
- OptionsPro
- Retirement Income Workshop
- Sure-Fire Trading Systems (VectorVest, Inc.)
- Trading as a Business Workshop
- VectorVest 7 EOD
- VectorVest 7 RealTime/IntraDay
- VectorVest AutoTester
- VectorVest Educational Services
- VectorVest OnLine
- VectorVest Options Analyzer
- VectorVest ProGraphics v6.0
- VectorVest ProTrader 7
- VectorVest RealTime Derby Tool
- VectorVest Simulator
- VectorVest Variator
- VectorVest Watchdog
- StockCharts.com, Inc.
- Candle Patterns
- Candlestick Charting Explained
- Intermarket Technical Analysis
- John Murphy on Chart Analysis
- John Murphy's Chart Pattern Recognition
- John Murphy's Market Message
- MurphyExplainsMarketAnalysis-Intermarket Analysis
- MurphyExplainsMarketAnalysis-Visual Analysis
- StockCharts.com
- Technical Analysis of the Financial Markets
- The Visual Investor