HOT TOPICS LIST
- MACD
- Fibonacci
- RSI
- Gann
- ADXR
- Stochastics
- Volume
- Triangles
- Futures
- Cycles
- Volatility
- ZIGZAG
- MESA
- Retracement
- Aroon
INDICATORS LIST
LIST OF TOPICS
PRINT THIS ARTICLE
by Mark Rivest
See why the bottom made on September 14, 2016 could signal the end of the bull market.
Position: N/A
Mark Rivest
Independent investment advisor, trader and writer. He has written articles for Technical Analysis of Stocks & Commodities, Traders.com Advantage,Futuresmag.com and, Finance Magnates. Author of website Four Dimension Trading.
PRINT THIS ARTICLE
ELLIOTT WAVE
Final Countdown for the Stock Bull Market
09/26/16 04:35:03 PMby Mark Rivest
See why the bottom made on September 14, 2016 could signal the end of the bull market.
Position: N/A
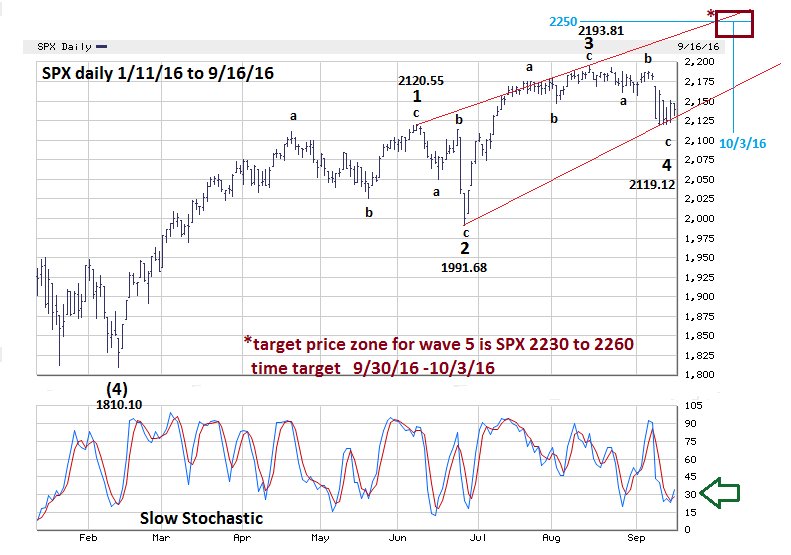
| Since April 20, 2016 the S&P 500 (SPX) has made seven consecutive turns related to the Fibonacci sequence. The rally off the most recent turn on September 14th could be the final rally of a bull market that began in March of 2009. Evidence is mounting from all four market dimensions; time, price, sentiment, and momentum that the largest stock market decline since 2008 could begin in just a few weeks. Price and Time Dimensions In my last article "Stock Market Lessons from Mr. Fibonacci - Part Three" I illustrated that four Fibonacci time cycles pointed to September 14th as the next turn and a likely bottom. Please see the daily SPX chart illustrated in Figure 1. On September 14th, the SPX low was 2119.90, only .78 above the low made on September 12th and only 3.30 points above the Fibonacci price target of 2116.60. Note that subsequently the daily Slow Stochastic has had a bullish crossover in the oversold zone, implying a new rally has begun. The Elliott wave price pattern since the low of the year made on February 11th appears to be taking the form of an Ending Diagonal Triangle (EDT), which is a termination pattern that occurs only in Elliott "fifth" and "C" waves. EDT's take a wedge shape and each sub wave subdivides into a "three" — note the a-b-c designations on the chart. They are also the only five wave structure within the main trend in which wave "four" almost always overlaps in the territory of wave "one". A major clue that an EDT is occurring is that the August - September decline has crossed into the territory of wave "one" which, in this case, is the June 8th top at SPX 2120.55. From the bottom made on February 11th there are four ways to calculate a price target of the supposed fifth wave of the EDT: 1) Waves "1" and "5" are usually related by Fibonacci ratios. Wave "1" which peaked at 2120.55 is 310.45 points x .382 = 118.59 + wave "4" bottom 2119.12 = 2237.71. 2) Wave "3" which peaked at 2193.81 is 202.13 points x .618 = 124.91 + wave "4" bottom 2119.12 = 2244.03. 3) Wave "2" bottomed at 1991.68 was 128.87 points x 2 = 257.74 + wave "2" bottom 1991.68 = 2249.42. 4) Wave "4" bottomed at 2119.12 was 74.69 points x 1.618 = 120.84 + wave "4" bottom 2119.12 = 2239.96. Four Fibonacci price coordinates in a tight range represents powerful resistance. As for the time target lets stick with what's working, the Fibonacci sequence. Thirteen trading days after September 14th targets October 3, 2016. Note that both price and time targets come close to the upper trend line that connects the peaks of wave "1" and "3". September 30th is also a candidate for a major top. That day has a new moon and occasionally markets will turn on new or full moons. September 30th is also the end of the third quarter. |

|
| Figure 1. The Elliott wave price pattern since the low of the year made on February 11th appears to be taking the form of an Ending Diagonal Triangle. |
| Graphic provided by: BigCharts.com. |
| |
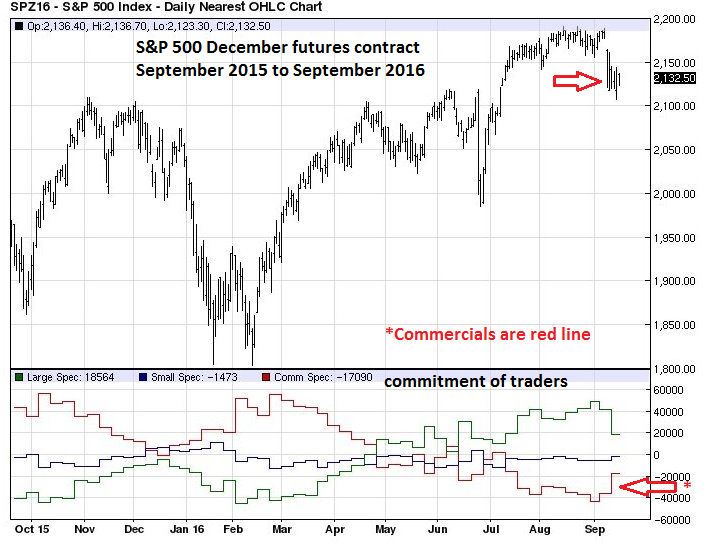
| Sentiment Dimension Please see the S&P 500 December futures chart illustrated in Figure 2. This is an update to the chart illustrated in "Stock Market Lessons from Mr. Fibonacci - Part Two" and shows the commitment of the three groups of traders; large, small, and commercials. The commercials are the ones to follow — they have the most money. The recent decline shows that the commercials have reduced their short position, which before the decline was the largest in over a year. If the commercials add to their short position as stocks rally it could be a very important signal of a major top forming. The commitment of traders for the S&P 500 futures could be the most important indicator to track. The commitment of traders can be viewed for free at Barchart.com. |

|
| Figure 2. The commercials are the ones to follow as they have the most money. |
| Graphic provided by: Barcharts.com. |
| |
| Summary and Strategy September to October is seasonally bearish, and with commercials still holding a relatively large short position there's too much risk for additional long positions. A break below SPX was the stop loss point for half of long positions. If not already liquidated, sell half of long positions as soon as possible. Maintain a stop loss on remaining longs at SPX 2060. While in the next several trading days there is a good chance stocks will rally, it's possible that all or some of the main US stock indices may not make a new 2016 high. Even if the SPX fifth wave of an EDT is correct, that supposed fifth wave could be truncated, meaning it doesn't exceed the August 15th peak at 2193.81. If the SPX can move above 2193.81 it could present an even greater shorting opportunity than the one in early August 2015. The rally from the September 14th bottom could be the final wave up of the bull market that began in March 2009. If the SPX makes a new all-time high, I will detail the wave count from 2009 and its implications for the balance of 2016 and beyond. In the meantime, follow the commercials traders of the S&P 500 futures; they could be giving us the biggest clue that the final countdown for the stock bull market has begun. Further Reading: Frost A.J and Robert Prechter (1985) "Elliott Wave Principle", New Classics Library. |
Independent investment advisor, trader and writer. He has written articles for Technical Analysis of Stocks & Commodities, Traders.com Advantage,Futuresmag.com and, Finance Magnates. Author of website Four Dimension Trading.
| Website: | www.fourdimensiontrading.com |
| E-mail address: | markrivest@gmail.com |
Click here for more information about our publications!
Comments
Date: 09/27/16Rank: 4Comment:
Date: 10/30/16Rank: 5Comment:

Request Information From Our Sponsors
- StockCharts.com, Inc.
- Candle Patterns
- Candlestick Charting Explained
- Intermarket Technical Analysis
- John Murphy on Chart Analysis
- John Murphy's Chart Pattern Recognition
- John Murphy's Market Message
- MurphyExplainsMarketAnalysis-Intermarket Analysis
- MurphyExplainsMarketAnalysis-Visual Analysis
- StockCharts.com
- Technical Analysis of the Financial Markets
- The Visual Investor
- VectorVest, Inc.
- Executive Premier Workshop
- One-Day Options Course
- OptionsPro
- Retirement Income Workshop
- Sure-Fire Trading Systems (VectorVest, Inc.)
- Trading as a Business Workshop
- VectorVest 7 EOD
- VectorVest 7 RealTime/IntraDay
- VectorVest AutoTester
- VectorVest Educational Services
- VectorVest OnLine
- VectorVest Options Analyzer
- VectorVest ProGraphics v6.0
- VectorVest ProTrader 7
- VectorVest RealTime Derby Tool
- VectorVest Simulator
- VectorVest Variator
- VectorVest Watchdog
