HOT TOPICS LIST
- MACD
- Fibonacci
- RSI
- Gann
- ADXR
- Stochastics
- Volume
- Triangles
- Futures
- Cycles
- Volatility
- ZIGZAG
- MESA
- Retracement
- Aroon
INDICATORS LIST
LIST OF TOPICS
PRINT THIS ARTICLE
by Koos van der Merwe
Any moving average based strategy does not function well when the share price moves in a sideways pattern. Here is a share that has given good profits in the past using the red/green strategy.
Position: Buy
Koos van der Merwe
Has been a technical analyst since 1969, and has worked as a futures and options trader with First Financial Futures in Johannesburg, South Africa.
PRINT THIS ARTICLE
MA CROSS
Moving Average Crossovers and the Red/Green Trading Strategy
11/26/02 03:45:02 PMby Koos van der Merwe
Any moving average based strategy does not function well when the share price moves in a sideways pattern. Here is a share that has given good profits in the past using the red/green strategy.
Position: Buy
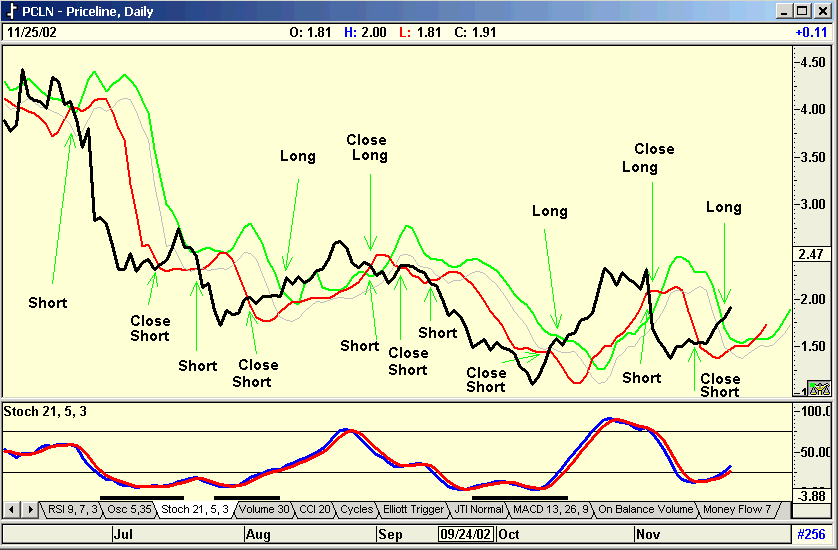
| The chart is almost self explanatory. Using the Red/Green trading strategy, ("Red/Green Trading Strategy", Traders.com Advantage, 9/30/2002) you buy the share when it crosses above the green moving average, which is a 1-day moving average of the HIGH offset forward by 10 days, and go short when the close crosses below the red moving average, which is a 1-day moving average of the LOW offset forward by 6 days. You would close out a position using a stop loss of recent price, a cross below a 3-day moving average (not shown) or as I have indicated in the chart, a break below/above the green/red moving average. |
| At the moment, the chart suggests that a buy has been given. This has been confirmed by the stochastic (21-5-3), and with the volatility of the price, a good profit could be made. |

|
| PRICELINE.COM |
| Graphic provided by: AdvancedGET. |
| |
| Point and figure horizontal count suggests a target of $7.3. With the BUY price at $1.80 by the time you would have purchased it, the target of $7.30 is well above my 2.5:1 risk reward ratio. (Using a 10% stop loss, my risk is 10% of 1.80, or 0.18. With a 2.5:1 risk reward ratio, the reward should be at least 2.5 x 0.18 = 0.45. Therefore, my minimum target would be $1.80 + 0.45 = $2.25.) |
| The share is a buy on any pullback. |
Has been a technical analyst since 1969, and has worked as a futures and options trader with First Financial Futures in Johannesburg, South Africa.
| Address: | 3256 West 24th Ave |
| Vancouver, BC | |
| Phone # for sales: | 6042634214 |
| E-mail address: | petroosp@gmail.com |
Click here for more information about our publications!
Comments
Date: 11/26/02Rank: 5Comment:
Date: 11/28/02Rank: 5Comment:
Date: 11/30/02Rank: 3Comment:
Date: 12/08/02Rank: 4Comment:
Date: 12/28/03Rank: 5Comment: Is the Red/Green Trading Strategy effective and profitable to use during intraday trading?
Thanks, Earl
Date: 12/28/03Rank: 5Comment: Is the Red/Green Trading Strategy effective and profitable to use during intraday trading?
Thanks, Earl

|

Request Information From Our Sponsors
- StockCharts.com, Inc.
- Candle Patterns
- Candlestick Charting Explained
- Intermarket Technical Analysis
- John Murphy on Chart Analysis
- John Murphy's Chart Pattern Recognition
- John Murphy's Market Message
- MurphyExplainsMarketAnalysis-Intermarket Analysis
- MurphyExplainsMarketAnalysis-Visual Analysis
- StockCharts.com
- Technical Analysis of the Financial Markets
- The Visual Investor
- VectorVest, Inc.
- Executive Premier Workshop
- One-Day Options Course
- OptionsPro
- Retirement Income Workshop
- Sure-Fire Trading Systems (VectorVest, Inc.)
- Trading as a Business Workshop
- VectorVest 7 EOD
- VectorVest 7 RealTime/IntraDay
- VectorVest AutoTester
- VectorVest Educational Services
- VectorVest OnLine
- VectorVest Options Analyzer
- VectorVest ProGraphics v6.0
- VectorVest ProTrader 7
- VectorVest RealTime Derby Tool
- VectorVest Simulator
- VectorVest Variator
- VectorVest Watchdog
