HOT TOPICS LIST
- MACD
- Fibonacci
- RSI
- Gann
- ADXR
- Stochastics
- Volume
- Triangles
- Futures
- Cycles
- Volatility
- ZIGZAG
- MESA
- Retracement
- Aroon
INDICATORS LIST
LIST OF TOPICS
PRINT THIS ARTICLE
by Koos van der Merwe
This is a strategy I developed for day trading that I found very successful.
Position: N/A
Koos van der Merwe
Has been a technical analyst since 1969, and has worked as a futures and options trader with First Financial Futures in Johannesburg, South Africa.
PRINT THIS ARTICLE
MOVING AVERAGES
Red/Green Trading Strategy
09/30/02 11:21:17 AMby Koos van der Merwe
This is a strategy I developed for day trading that I found very successful.
Position: N/A
| During the "bubble" in the market, when everyone and his cat were day trading and making pots of money, I spent a day at the local bookstore reading every book published on day trading, looking for a strategy that I could associate with, yet was simple and easy to follow. The book I eventually bought had four pages out of the 180-odd that interested me, and I spent many hours developing an algorithm for Technifilter Plus so that I could optimize the strategy over a range of stocks before working out a visual chart using Advanced Get. |
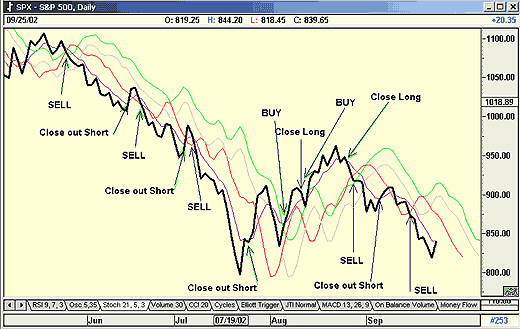
| The chart below shows the end result, and although here I have applied it to the S&P 500 index, I have often used it on a volatile share as an end of day trading strategy. Unfortunately, my programs are not set up to test it on intraday data, but I don't see why it wouldn't work on a minute chart. |

|
| SPX Trading Chart |
| Graphic provided by: AdvancedGET. |
| |
| So, what do all the lines mean? I decided that I would BUY (go long) when a stock/index moved above the high of ten days ago, and I would SELL (go short) when the stock/Index moved below its low of six days ago. With Technifilter Plus, it was easy to write a formula -- "Buy if todays close is greater than the high of ten days ago" is simply "C > HY10" where C = close, and H = high. With a chart however, it is different. I have to plot a moving average of the high and offset it forward by 10 days. In the chart above, the thick black line is the close, the green line is the high of ten days ago, and the red line is the low of six days ago. I have added the gray line as the low of 10 days ago as an early warning buy signal, and added a 3-day moving average trigger (maroon line) to take me out of the market. I chose 10 and 6 as the moving average parameters because a trading week is five days, so 10 days is two trading weeks, while six days is one trading week plus one day. Since down (bear) moves typically fall faster than up (bull) moves rise, I chose to make the parameter for the short signal (6) smaller than the parameter for the long signal (10). |
| Complicated? A little, but very, very successful, not on all stocks, but on a large majority, especially those with a high volatility. It can also be applied with success to the Futures market. |
| Today, I am inclined to use the strategy more as an Index watcher than as a day trading strategy although in past years I have used it with great success. Enjoy! |
Has been a technical analyst since 1969, and has worked as a futures and options trader with First Financial Futures in Johannesburg, South Africa.
| Address: | 3256 West 24th Ave |
| Vancouver, BC | |
| Phone # for sales: | 6042634214 |
| E-mail address: | petroosp@gmail.com |
Click here for more information about our publications!
Comments
Date: 10/03/02Rank: 3Comment:
Date: 10/03/02Rank: 4Comment:
Date: 11/30/02Rank: 3Comment:
Date: 02/08/03Rank: 5Comment:
Date: 01/19/04Rank: 5Comment: To Jacob Singer
I am looking for good day trading strategies and would be interested in the RED/GREEN STRATEGY. If I view stocks on Metastock end of day data, how would I incorporate this with day trading, in your opinion? THANKS

Request Information From Our Sponsors
- StockCharts.com, Inc.
- Candle Patterns
- Candlestick Charting Explained
- Intermarket Technical Analysis
- John Murphy on Chart Analysis
- John Murphy's Chart Pattern Recognition
- John Murphy's Market Message
- MurphyExplainsMarketAnalysis-Intermarket Analysis
- MurphyExplainsMarketAnalysis-Visual Analysis
- StockCharts.com
- Technical Analysis of the Financial Markets
- The Visual Investor
- VectorVest, Inc.
- Executive Premier Workshop
- One-Day Options Course
- OptionsPro
- Retirement Income Workshop
- Sure-Fire Trading Systems (VectorVest, Inc.)
- Trading as a Business Workshop
- VectorVest 7 EOD
- VectorVest 7 RealTime/IntraDay
- VectorVest AutoTester
- VectorVest Educational Services
- VectorVest OnLine
- VectorVest Options Analyzer
- VectorVest ProGraphics v6.0
- VectorVest ProTrader 7
- VectorVest RealTime Derby Tool
- VectorVest Simulator
- VectorVest Variator
- VectorVest Watchdog
