

HOT TOPICS LIST
- MACD
- Fibonacci
- RSI
- Gann
- ADXR
- Stochastics
- Volume
- Triangles
- Futures
- Cycles
- Volatility
- ZIGZAG
- MESA
- Retracement
- Aroon
INDICATORS LIST
LIST OF TOPICS
PRINT THIS ARTICLE
by Matt Blackman
Stocks have continued to rally despite the calls for a correction from pundits. But how much more room have they got to run?
Position: N/A
Matt Blackman
Matt Blackman is a full-time technical and financial writer and trader. He produces corporate and financial newsletters, and assists clients in getting published in the mainstream media. He is the host of TradeSystemGuru.com. Matt has earned the Chartered Market Technician (CMT) designation. Find out what stocks and futures Matt is watching on Twitter at www.twitter.com/RatioTrade
PRINT THIS ARTICLE
MARKET TIMING
A Tale Of Two Macro Market Valuation Indicators
03/27/15 03:54:24 PMby Matt Blackman
Stocks have continued to rally despite the calls for a correction from pundits. But how much more room have they got to run?
Position: N/A
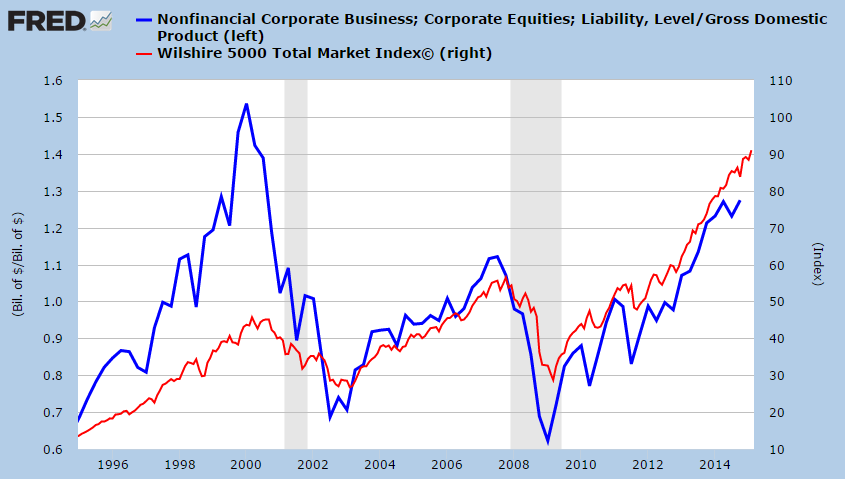
| It's been nearly a year since I updated an indicator that Warren Buffett has said is "probably the best single measure of where valuations stand at any given moment." In the year since writing Warren's Best Valuation Measure And Other Charts Updated when the indicator posted a reading of 114%, it has continued to climb, dropped for the first time in more than a year before it resurged to put in a (marginally) higher high. As we see from Figure 1, the last time the indicator peaked and then suffered a significant drop was Q4-2007 which coincided with the onset of the subprime mortgage derivative crisis that precipitated the global financial crisis. |
|
| Figure 1. Warren Buffett's Best Valuation Measure. Warren Buffett�s �favorite market index� shows the latest Fed data as of Q4-2014 in which total US market capitalization divided by GDP hit 127.4% after dropping the previous quarter from the Q1 high of 127%. |
| Graphic provided by: St Louis Federal Reserve. |
| |
| Although interesting, there are two challenges with using the indicator in real time. First, the data from the Federal Reserve is published six months late. Second, as we saw in 2011 and 2012, a drop of two quarters does not necessarily signal a major stock market top. However, given that the indicator is getting lofty and is currently the second highest reading in modern history, to ignore that stock prices are getting lofty from a historical standpoint could be an expensive oversight. |
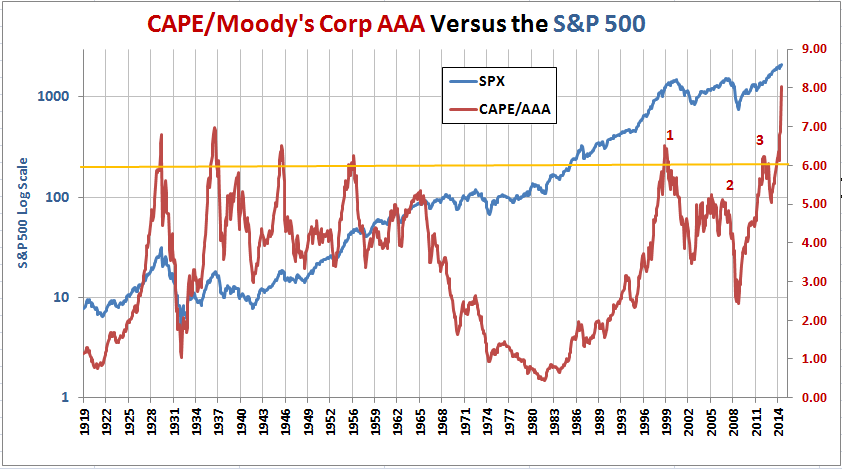
| This take is further confirmed by the next indicator, which I last discussed in my August 2014 article Another Long-Term Stock Indicator Stuck On The Ceiling which examined an interesting macro market indicator favored by economist Robert Shiller called cyclically adjusted price earnings, divided by the Moody's Corporate AAA bond rate. As you see in Figure 2, since then the indicator (red line) has climbed to highs never experienced before thanks to record low interest rates which have remained stuck in the basement since 2009. |
|
| Figure 2. CAPE/Moody's Corp AAA. Here you see a graph comparing S&P 500 cyclically-adjusted PEs (CAPE) calculated by Robert Shiller divided by Moody�s corporate AAA Bonds to the S&P 500 since 1919. The peaks in CAPE/AAA since 1999 are numbered 1 through 3 and they preceded the last three SPX corrections. |
| Graphic provided by: Robert Shiller and the St Louis Federal Reserve. |
| |
| Note what has happened to stock prices when this indicator has peaked going back to the 1920s. But rather than peak when this indicator moved above six in July 2014, which has historically represented the danger zone, it kept going before hitting a value of 8.05 in February 2015 and so have stock prices. |
| Put these two indicators together and what do you have? Using two difference valuation metrics, stocks are getting quite extended. Can they get more so? Absolutely, given that analysts who have been warning of this for the last two years would attest. The challenge comes when you consider what will happen when the correction finally arrives since the longer prices get extended, the greater the probability and severity of a drop in the subsequent reversion to a long-term valuation mean correction. |
Matt Blackman is a full-time technical and financial writer and trader. He produces corporate and financial newsletters, and assists clients in getting published in the mainstream media. He is the host of TradeSystemGuru.com. Matt has earned the Chartered Market Technician (CMT) designation. Find out what stocks and futures Matt is watching on Twitter at www.twitter.com/RatioTrade
| Company: | TradeSystemGuru.com |
| Address: | Box 2589 |
| Garibaldi Highlands, BC Canada | |
| Phone # for sales: | 604-898-9069 |
| Fax: | 604-898-9069 |
| Website: | www.tradesystemguru.com |
| E-mail address: | indextradermb@gmail.com |
Traders' Resource Links | |
| TradeSystemGuru.com has not added any product or service information to TRADERS' RESOURCE. | |
Click here for more information about our publications!
Comments

Request Information From Our Sponsors
- VectorVest, Inc.
- Executive Premier Workshop
- One-Day Options Course
- OptionsPro
- Retirement Income Workshop
- Sure-Fire Trading Systems (VectorVest, Inc.)
- Trading as a Business Workshop
- VectorVest 7 EOD
- VectorVest 7 RealTime/IntraDay
- VectorVest AutoTester
- VectorVest Educational Services
- VectorVest OnLine
- VectorVest Options Analyzer
- VectorVest ProGraphics v6.0
- VectorVest ProTrader 7
- VectorVest RealTime Derby Tool
- VectorVest Simulator
- VectorVest Variator
- VectorVest Watchdog
- StockCharts.com, Inc.
- Candle Patterns
- Candlestick Charting Explained
- Intermarket Technical Analysis
- John Murphy on Chart Analysis
- John Murphy's Chart Pattern Recognition
- John Murphy's Market Message
- MurphyExplainsMarketAnalysis-Intermarket Analysis
- MurphyExplainsMarketAnalysis-Visual Analysis
- StockCharts.com
- Technical Analysis of the Financial Markets
- The Visual Investor