

HOT TOPICS LIST
- MACD
- Fibonacci
- RSI
- Gann
- ADXR
- Stochastics
- Volume
- Triangles
- Futures
- Cycles
- Volatility
- ZIGZAG
- MESA
- Retracement
- Aroon
INDICATORS LIST
LIST OF TOPICS
PRINT THIS ARTICLE
by Matt Blackman
There has been a debate raging over the last year about whether stock prices are getting too expensive. Here is another indicator that says they are.
Position: N/A
Matt Blackman
Matt Blackman is a full-time technical and financial writer and trader. He produces corporate and financial newsletters, and assists clients in getting published in the mainstream media. He is the host of TradeSystemGuru.com. Matt has earned the Chartered Market Technician (CMT) designation. Find out what stocks and futures Matt is watching on Twitter at www.twitter.com/RatioTrade
PRINT THIS ARTICLE
MARKET TIMING
Another Long-Term Stock Indicator Stuck On The Ceiling
08/15/14 06:37:50 PMby Matt Blackman
There has been a debate raging over the last year about whether stock prices are getting too expensive. Here is another indicator that says they are.
Position: N/A
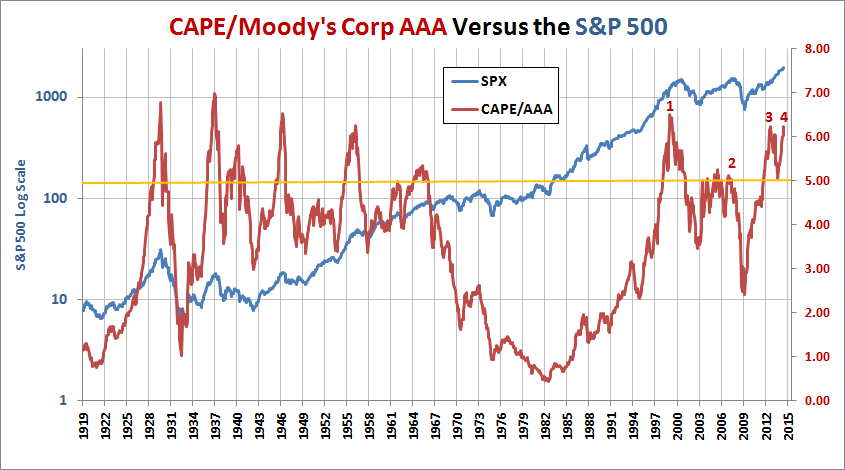
| In "Top Spotting: Knowing What You Need to Stay Out of Trouble" I looked at a number of indicators that showed stock valuations and other indicators at extreme levels by historic standards. In a recent Chart Focus entitled "A Scary Valuation Indicator," Tom McClellan of www.mcoscillator.com discussed an indicator that he'd learned from Daniel Want (Prerequisite Capital Management) that showed a very interesting correlation between S&P Cyclically Adjusted PEs divided by Moody's BBB Corporate Bond yields and the S&P 500 Index. In fact, the indicator has proven to be uncannily accurate at anticipating extremes in the SPX. |
|
| Figure 1 � Graph comparing S&P 500 Cyclically-Adjusted PEs (CAPE) divided by Moody�s Corporate AAA Bonds to the S&P 500 since 1919 showing peaks in CAPE/AAA since 1999 numbered 1 through 4. |
| Graphic provided by: Robert Shiller�s CAPE data & St. Louis Fed Reserve. |
| |
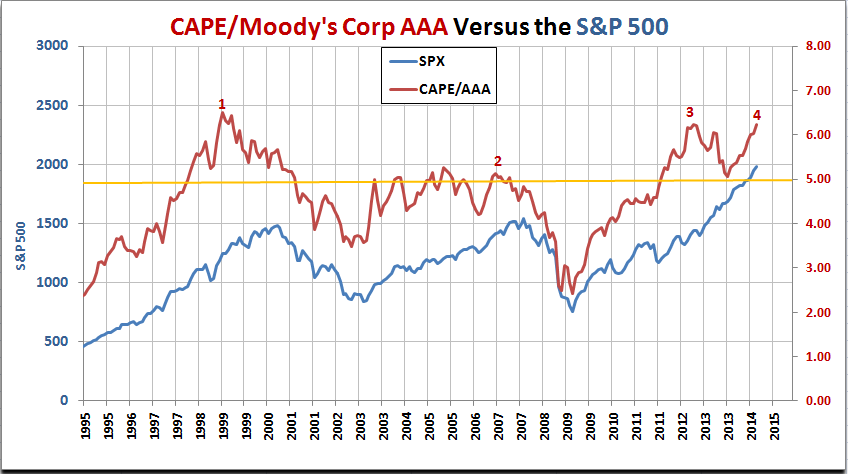
| I downloaded data but instead used Moody's AAA Corporate Bond yield data, which shows a very similar relationship when paired with cyclically-adjusted price earnings data (from Robert Shiller). There is no absolute level that guarantees a stock peak, only levels beyond which the CAPE/AAA ratio is at risky levels. As we see in Figure 1, levels above 5 occur near extreme stock valuations and levels above 6 are rarer. As McClellan explained it, the indicator works because at or near market extremes, investors have a habit of bidding up to a "ridiculous point such that the earnings yield is way out of whack from the bond interest yield." The CAPE/AAA indicator reaches extremes when PEs are at extreme levels while AAA yields are not. In other words, stock investors are very bullish (exuberant) while bond investors are more pessimistic. As we see in the next chart for the period from 1995 to 2014, peak 1 occurred in early 1999, more than a year ahead of the SPX peak in March 2000. |
|
| Figure 2 � Close-up comparing peaks in CAPE/Moody�s AAA and the S&P 500. |
| Graphic provided by: Robert Shiller�s CAPE data. |
| |
| The next CAPE/AAA peak is less clear except that the indicator first ventured above 5 in mid-2003, then again in 2005, 2006 and again in 2007 before stock prices finally peaked in October 2007. It is interesting to note that CAPE/AAA hits a low in March 2009 just as the next stock rally was getting underway. |
| In early 2011, it moved above 5 again where it remained for the next three plus years with the latest peak hitting a value of 6.24 (which was also hit in 2012 at point 3) in mid-July 2014. CAPE/AAA values above 6 have only occurred 9 times including the last two extremes in 2012 and 2014. |
| As the charts show, there is no absolute level from which stock prices have historically peaked and there can be a number of CAPE/AAA peaks in the interim before stock prices began a serious retreat. But what these data points show is that it's only a matter of time, probabilistically speaking, before the next stock peak is hit and a serious correction follows. |
Matt Blackman is a full-time technical and financial writer and trader. He produces corporate and financial newsletters, and assists clients in getting published in the mainstream media. He is the host of TradeSystemGuru.com. Matt has earned the Chartered Market Technician (CMT) designation. Find out what stocks and futures Matt is watching on Twitter at www.twitter.com/RatioTrade
| Company: | TradeSystemGuru.com |
| Address: | Box 2589 |
| Garibaldi Highlands, BC Canada | |
| Phone # for sales: | 604-898-9069 |
| Fax: | 604-898-9069 |
| Website: | www.tradesystemguru.com |
| E-mail address: | indextradermb@gmail.com |
Traders' Resource Links | |
| TradeSystemGuru.com has not added any product or service information to TRADERS' RESOURCE. | |
Click here for more information about our publications!
Comments

Request Information From Our Sponsors
- StockCharts.com, Inc.
- Candle Patterns
- Candlestick Charting Explained
- Intermarket Technical Analysis
- John Murphy on Chart Analysis
- John Murphy's Chart Pattern Recognition
- John Murphy's Market Message
- MurphyExplainsMarketAnalysis-Intermarket Analysis
- MurphyExplainsMarketAnalysis-Visual Analysis
- StockCharts.com
- Technical Analysis of the Financial Markets
- The Visual Investor
- VectorVest, Inc.
- Executive Premier Workshop
- One-Day Options Course
- OptionsPro
- Retirement Income Workshop
- Sure-Fire Trading Systems (VectorVest, Inc.)
- Trading as a Business Workshop
- VectorVest 7 EOD
- VectorVest 7 RealTime/IntraDay
- VectorVest AutoTester
- VectorVest Educational Services
- VectorVest OnLine
- VectorVest Options Analyzer
- VectorVest ProGraphics v6.0
- VectorVest ProTrader 7
- VectorVest RealTime Derby Tool
- VectorVest Simulator
- VectorVest Variator
- VectorVest Watchdog