HOT TOPICS LIST
- MACD
- Fibonacci
- RSI
- Gann
- ADXR
- Stochastics
- Volume
- Triangles
- Futures
- Cycles
- Volatility
- ZIGZAG
- MESA
- Retracement
- Aroon
INDICATORS LIST
LIST OF TOPICS
PRINT THIS ARTICLE
by Matt Blackman
As markets continue higher some historic market indicators, including one of Mr. Buffett's favorites, get even more stretched.
Position: N/A
Matt Blackman
Matt Blackman is a full-time technical and financial writer and trader. He produces corporate and financial newsletters, and assists clients in getting published in the mainstream media. He is the host of TradeSystemGuru.com. Matt has earned the Chartered Market Technician (CMT) designation. Find out what stocks and futures Matt is watching on Twitter at www.twitter.com/RatioTrade
PRINT THIS ARTICLE
CHART ANALYSIS
Warren's Best Valuation Measure And Other Charts Updated
04/09/14 04:52:18 PMby Matt Blackman
As markets continue higher some historic market indicators, including one of Mr. Buffett's favorites, get even more stretched.
Position: N/A
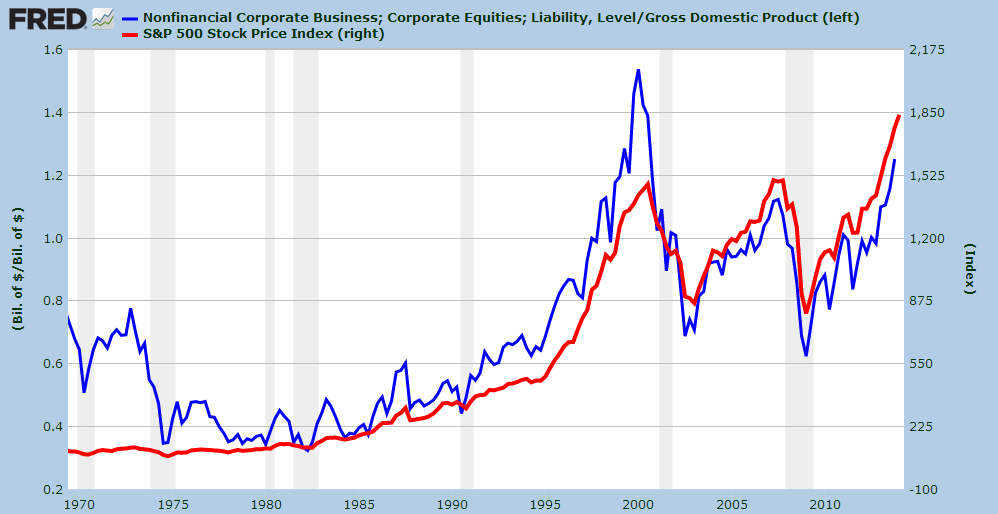
| In my article "Warren's Best Valuation Measure", I discussed a metric that Warren Buffett has used in the past as an overall gauge of market valuation — US stock market capitalization to GDP (blue line). Since that article was published, the indicator has continued to climb higher and according to the latest Fed Reserve data, is now above where it peaked in Q3-2007 (see Figure 1). Meanwhile, the S&P 500 (red line) continues to charge higher with seemingly never-ending vigor. Does that mean stocks are in for a big correction? That is the trillion-dollar question. |

|
| Figure 1 – Chart comparing total US stock market capitalization/GDP to the S&P 500 Index. |
| Graphic provided by: St Louis Federal Reserve.. |
| |
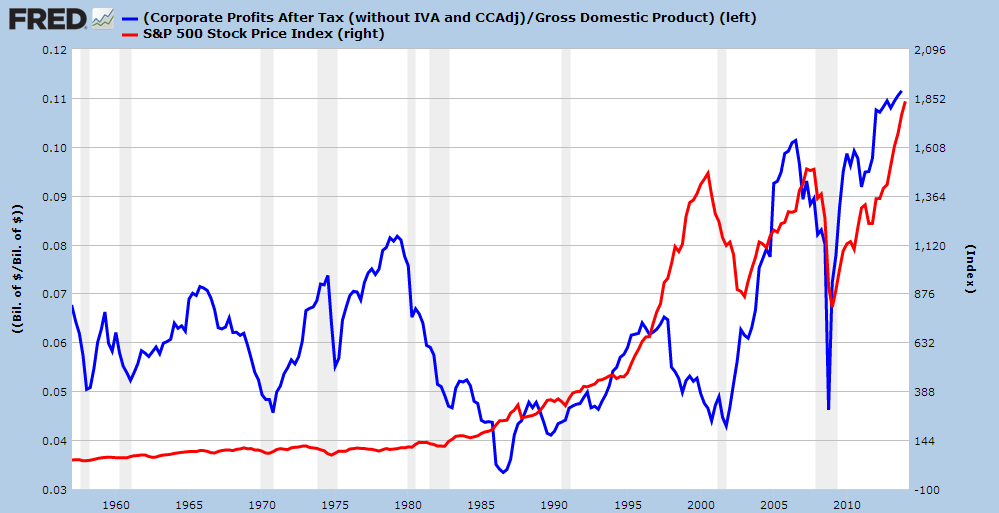
| One big reason why stocks continue to rally higher is that corporate profits after tax as a percentage of GDP (CPAT-GDP) have never been higher and now stand well above where they were at the peak in 2007 (see Figure 2). It's also interesting to note that CPAT-GDP peaked well ahead of stocks in 1997 due to the incredible exuberance that dominated markets during the final stages of the Internet bubble. CPAT-GDP also peaked in Q3-2006 a year ahead of the 2007 market peak. However, as of the latest data (Q4-2013), corporate profits were still rising. |

|
| Figure 2 – Chart comparing corporate profits after tax/GDP (blue) with the S&P 500 (red). |
| Graphic provided by: St Louis Federal Reserve.. |
| |
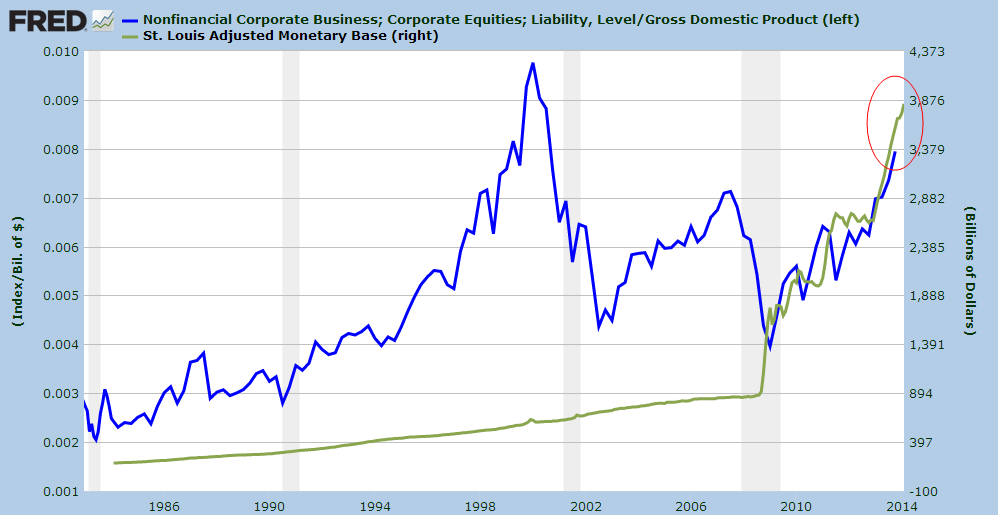
| One factor driving both stock market capitalization and corporate profits continues to be never ending supplies of cash equivalents being pumped into markets courtesy of Federal Reserve Quantitative Easing efforts. As we see in Figure 3, comparing Warren's favorite valuation metric (blue) versus the size of the Federal Reserve balance sheet monetary base (green), the monetary updraft has continued to lead market cap higher even after recent (but barely discernible on the chart) efforts at "Tapering." |

|
| Figure 3 – Here we see Warren’s favorite valuation measure to Q4 – 2013 compared to the rapidly expanding size of the Federal Reserve balance sheet to February 2014. |
| Graphic provided by: St Louis Federal Reserve.. |
| |
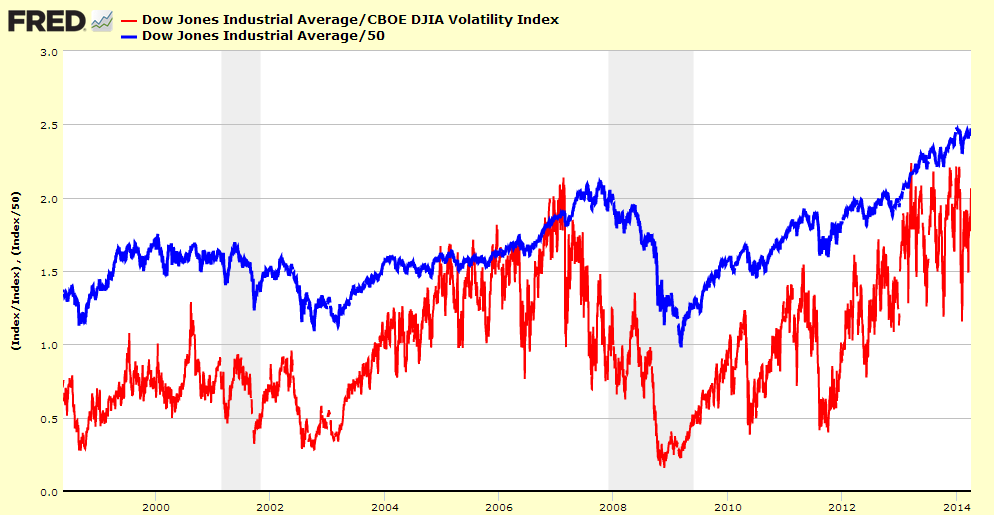
| Our final chart updates those published in "The Blue Sky Index - Another Market Topping Signal". The Blue Sky Index is the Dow Jones Industrial Average divided by the CBOE Dow Jones Industrial Average Volatility Index (red) which as we see in the chart below put in a lower high on January 17, 2014 following the previous peak March 12, 2013. The previous Blue Sky peak occurred in February 2007 well ahead of the SPX peak in late October. |

|
| Figure 4 – The Blue Sky Index versus the Dow Jones Industrial Average (divided by 50 for comparison purposes) showing how the Blue Sky has led the Dow in both 2007 and 2000. |
| Graphic provided by: St Louis Federal Reserve.. |
| |
| Few would disagree that thanks to the new world of Federal Reserve controlled money flow, markets are in uncharted territory. So when will stock markets correct given how stretched these and other indicators appear? It is likely that we will see Warren's valuation metric peak and drop as well as a measurable drop in the Blue Sky Index first. But one thing is clear. The longer markets continue to stretch higher, the greater the ultimate reversion to the mean snap-back will be. |
Matt Blackman is a full-time technical and financial writer and trader. He produces corporate and financial newsletters, and assists clients in getting published in the mainstream media. He is the host of TradeSystemGuru.com. Matt has earned the Chartered Market Technician (CMT) designation. Find out what stocks and futures Matt is watching on Twitter at www.twitter.com/RatioTrade
| Company: | TradeSystemGuru.com |
| Address: | Box 2589 |
| Garibaldi Highlands, BC Canada | |
| Phone # for sales: | 604-898-9069 |
| Fax: | 604-898-9069 |
| Website: | www.tradesystemguru.com |
| E-mail address: | indextradermb@gmail.com |
Traders' Resource Links | |
| TradeSystemGuru.com has not added any product or service information to TRADERS' RESOURCE. | |
Click here for more information about our publications!
Comments
Date: 04/12/14Rank: 3Comment:

Request Information From Our Sponsors
- StockCharts.com, Inc.
- Candle Patterns
- Candlestick Charting Explained
- Intermarket Technical Analysis
- John Murphy on Chart Analysis
- John Murphy's Chart Pattern Recognition
- John Murphy's Market Message
- MurphyExplainsMarketAnalysis-Intermarket Analysis
- MurphyExplainsMarketAnalysis-Visual Analysis
- StockCharts.com
- Technical Analysis of the Financial Markets
- The Visual Investor
- VectorVest, Inc.
- Executive Premier Workshop
- One-Day Options Course
- OptionsPro
- Retirement Income Workshop
- Sure-Fire Trading Systems (VectorVest, Inc.)
- Trading as a Business Workshop
- VectorVest 7 EOD
- VectorVest 7 RealTime/IntraDay
- VectorVest AutoTester
- VectorVest Educational Services
- VectorVest OnLine
- VectorVest Options Analyzer
- VectorVest ProGraphics v6.0
- VectorVest ProTrader 7
- VectorVest RealTime Derby Tool
- VectorVest Simulator
- VectorVest Variator
- VectorVest Watchdog
