

HOT TOPICS LIST
- MACD
- Fibonacci
- RSI
- Gann
- ADXR
- Stochastics
- Volume
- Triangles
- Futures
- Cycles
- Volatility
- ZIGZAG
- MESA
- Retracement
- Aroon
INDICATORS LIST
LIST OF TOPICS
PRINT THIS ARTICLE
by Matt Blackman
If you suspected that markets might be getting frothy a few months ago, this should interest you.
Position: Sell
Matt Blackman
Matt Blackman is a full-time technical and financial writer and trader. He produces corporate and financial newsletters, and assists clients in getting published in the mainstream media. He is the host of TradeSystemGuru.com. Matt has earned the Chartered Market Technician (CMT) designation. Find out what stocks and futures Matt is watching on Twitter at www.twitter.com/RatioTrade
PRINT THIS ARTICLE
VOLATILITY
The Blue Sky Index - Another Market Top Warning Signal
08/08/13 03:48:29 PMby Matt Blackman
If you suspected that markets might be getting frothy a few months ago, this should interest you.
Position: Sell
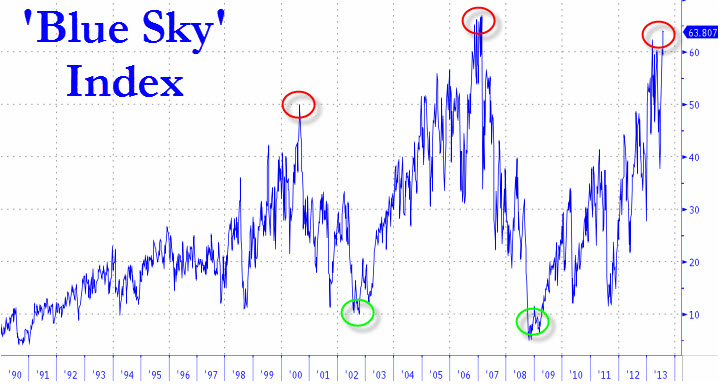
| In a previous TCA article entitled "More Stock Market Topping Signs," I discussed some of the signs that had been generated which warned that stocks were approaching a major market top. The challenge for short-term traders is that the biggest gains for many stocks come in the final phase of a top which often presents itself as a parabolic blow-off. But there is little doubt that we are now in a dangerous territory, especially for investors and longer-horizon traders. According to Sean Corrigan, Diapason Commodity Management's Chief Market Strategist, who developed a simple yet intriguing indicator called the Blue Sky Index (Figure 1), the U.S. economy has seen its best days for this phase of the business and commodities cycle. The Blue Sky Index is the S&P 100 Index (OEX) divided by the CBOE Market Volatility Index or VIX and has generated accurate advance warnings of market tops (and bottoms) over the last few decades. It is now at the top end of the 99th percentile of all readings since the VIX was created. |
|
| Figure 1. The Blue Sky Index which is a measure of investor complacency together with S&P 100 Index. When it is high it shows that investors are bullish and fear is low. Extremes have warned at previous market tops and lows have provided advance warning of major lows. |
| Graphic provided by: Sean Corrigan � Diapason Commodity Management, Swi. |
| |
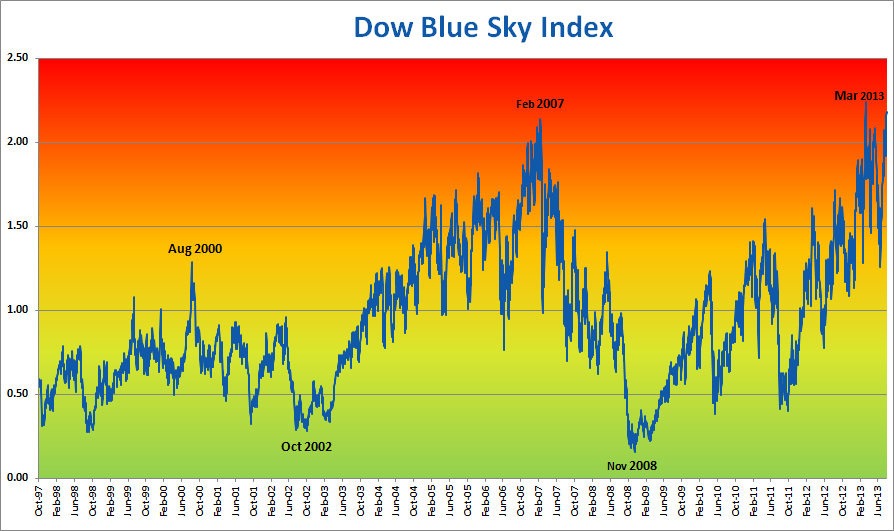
| The Blue Sky Index is so elegantly simple because it peaks when stocks have hit new highs and volatility is at historic lows, thereby providing clear and highly visible spikes. Armed with this information, I decided to use the same concept to develop a Blue Sky Index for the Dow Jones Industrial Average to see if the signals were similar. As we see in Figure 2, the 2000 top warning came a little later for the Dow than it did for the OEX, which was explained by the fact that the Dow peaked approximately nine months after the OEX. But as the chart also shows, the Dow Blue Sky Index (DBSI) bottomed well before stocks did in 2003 and peaked six months before stocks in 2007. It bottomed again five months before stocks in 2002 and the latest Dow peak occurred in March 2013. But unlike the OEX Blue Sky signal, the DBSI put in a lower high in early August. |
|
| Figure 2. Chart of the Dow Jones Industrial Average divided by the CBOE Dow Jones Industrial Average Volatility Index showing prior highs and lows. Note that unlike the S&P 100, the Dow is at higher risk extreme than it was in 2007. |
| Graphic provided by: St. Louis Federal Reserve. |
| |
| This is only the latest warning sign that markets are indeed getting stretched — they are now at a level only matched three other times in history according to Prometheus Market Insights: 1929, 2000 and 2007 which are the greatest bubble tops in the last 85 years. |
| I will be examining these indicators and others in much more detail in upcoming articles in Working Money. Stay tuned! |
Matt Blackman is a full-time technical and financial writer and trader. He produces corporate and financial newsletters, and assists clients in getting published in the mainstream media. He is the host of TradeSystemGuru.com. Matt has earned the Chartered Market Technician (CMT) designation. Find out what stocks and futures Matt is watching on Twitter at www.twitter.com/RatioTrade
| Company: | TradeSystemGuru.com |
| Address: | Box 2589 |
| Garibaldi Highlands, BC Canada | |
| Phone # for sales: | 604-898-9069 |
| Fax: | 604-898-9069 |
| Website: | www.tradesystemguru.com |
| E-mail address: | indextradermb@gmail.com |
Traders' Resource Links | |
| TradeSystemGuru.com has not added any product or service information to TRADERS' RESOURCE. | |
Click here for more information about our publications!
Comments

Request Information From Our Sponsors
- VectorVest, Inc.
- Executive Premier Workshop
- One-Day Options Course
- OptionsPro
- Retirement Income Workshop
- Sure-Fire Trading Systems (VectorVest, Inc.)
- Trading as a Business Workshop
- VectorVest 7 EOD
- VectorVest 7 RealTime/IntraDay
- VectorVest AutoTester
- VectorVest Educational Services
- VectorVest OnLine
- VectorVest Options Analyzer
- VectorVest ProGraphics v6.0
- VectorVest ProTrader 7
- VectorVest RealTime Derby Tool
- VectorVest Simulator
- VectorVest Variator
- VectorVest Watchdog
- StockCharts.com, Inc.
- Candle Patterns
- Candlestick Charting Explained
- Intermarket Technical Analysis
- John Murphy on Chart Analysis
- John Murphy's Chart Pattern Recognition
- John Murphy's Market Message
- MurphyExplainsMarketAnalysis-Intermarket Analysis
- MurphyExplainsMarketAnalysis-Visual Analysis
- StockCharts.com
- Technical Analysis of the Financial Markets
- The Visual Investor