

HOT TOPICS LIST
- MACD
- Fibonacci
- RSI
- Gann
- ADXR
- Stochastics
- Volume
- Triangles
- Futures
- Cycles
- Volatility
- ZIGZAG
- MESA
- Retracement
- Aroon
INDICATORS LIST
LIST OF TOPICS
PRINT THIS ARTICLE
by Alan R. Northam
Statistical analysis shows traders becoming less aggressive in buying the individual stocks making up the Dow Jones Industrial Average. This normally occurs near the end of a long-term upward trend.
Position: N/A
Alan R. Northam
Alan Northam lives in the Dallas, Texas area and as an electronic engineer gave him an analytical mind from which he has developed a thorough knowledge of stock market technical analysis. His abilities to analyze the future direction of the stock market has allowed him to successfully trade of his own portfolio over the last 30 years. Mr. Northam is now retired and trading the stock market full time. You can reach him at inquiry@tradersclassroom.com or by visiting his website at http://www.tradersclassroom.com. You can also follow him on Twitter @TradersClassrm.
PRINT THIS ARTICLE
STATISTICS
Traders Less Aggressive - DJIA Closer To End
10/24/14 05:06:51 PMby Alan R. Northam
Statistical analysis shows traders becoming less aggressive in buying the individual stocks making up the Dow Jones Industrial Average. This normally occurs near the end of a long-term upward trend.
Position: N/A
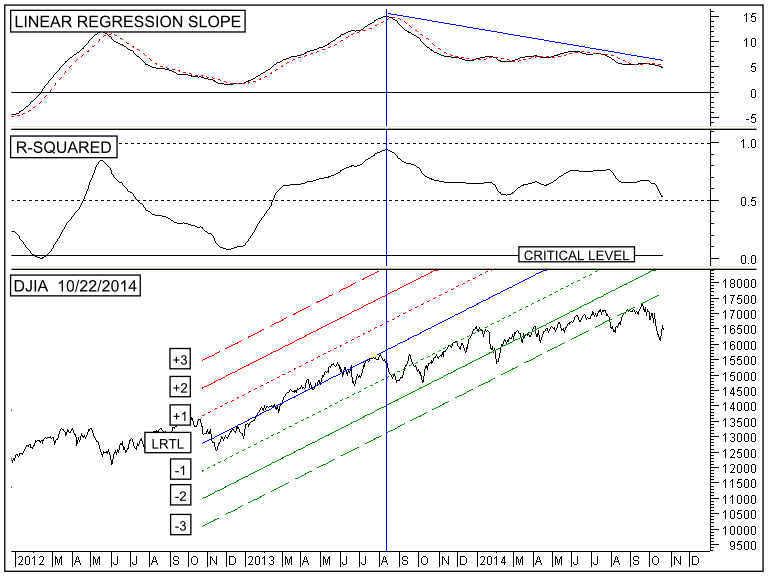
| So far over the last year I have written two articles warning the end of the long term upward trend in the Dow Jones Industrial Average is approaching. The first article was published on November 6, 2013 under the title "Trend Ending For The Dow Jones Industrials" and the second article on April 29, 2014 entitled "Long Term Trend of the Dow Nears End". Recently, the Dow Jones Industrial Average (DJIA) pushed to a new all time high above 17,000. While the second of these two articles is still relevent there is a need to update the analysis. The bottom panel of Figure 1 shows the daily closing price of the DJIA. This figure also shows the 200-day Linear Regression trend line (upward sloping blue line) labeled LRTL. This figure also shows the +1, +2, +3, and -1, -2, and -3 sigma channel lines labeled appropriately. The red channel lines represent resistance lines and the green channel lines represent support. |
| A vertical blue line is drawn off the peak of the Linear Regression Slope indicator (see top panel). The LRTL (bottom panel) and its associated upper and lower sigma channel lines are drawn on the chart to the left of the vertical blue line from mid-October 2012 to mid-August 2013 and cover a period of 200 trading sessions (days). The upward slope of these lines are determined by these 200 trading sessions. To the right of the vertical blue line the LRTL and channel lines extend to show the projected future path of price. Note that the vertical blue line was first placed on the chart in August 2013 when the Linear Regression Slope indicator peaked. The upward sloping lines to the right of this vertical blue line were then projected forward in time to represent the future price trend (LRTL), resistance lines, and support lines. Since that time the chart has been filled in with actual daily closing prices. |
|
| Figure 1. DJIA, Daily. This chart shows the daily price chart of the Dow Jones Industrial Average (DJIA) in the lower panel along with its 200-day linear regression trend line and channel lines. The top panel shows the Linear Regression Slope indicator followed by the R-Squared indicator in the middle panel. |
| Graphic provided by: MetaStock. |
| Graphic provided by: Serif DrawPlus X3 (Graphic Editor). |
| |
| In the top panel of Figure 1 is plotted the Linear Regression Slope indicator. When this indicator is above its zero line the long-term trend is upward, and when below zero the long-term trend is downward. The Linear Regression Slope indicator measures the slope of the LRTL (bottom panel) over the last 200 trading days. The further above the zero line the indicator moves, the steeper the 200 day upward sloping LRTL. The further below the zero line the indicator moves, the steeper the downward sloping LRTL over the last 200 trading days. Notice from the peak in August 2013, the Linear Regression Slope indicator has been moving in a downward direction. This indicates the rate at which the individual shares of the 30 stocks making up the DJIA is being accumulated is slowing down. This phenomenon can also be seen in the bottom panel where price continues to move further away from the LRTL. This suggests a period of price deceleration taking place. By price deceleration it is meant that the ratio of the most recent price to that of 200 days ago is getting smaller with time. Price deceleration typically occurs near the end of a trend. The story the Linear Regression Slope indicator is telling is that traders are less aggressively buying stocks. This is a normal action that takes place near end of a trend when traders are unsure as to whether they should be adding to, or selling off their positions. |
| The next lower panel shows the R-Squared indicator, a measure of confidence in the trend as well as a measure of strength. When this indicator is above its statistically derived critical level of 0.03, for a 200-day look back period, it indicates a 95% statistical confidence level the current trend will continue. When this indicator is below its critical level, confidence falls. Statistically speaking, when there exists a 95% confidence level that the trend will continue, it means that the slope of the LRTL will continue to slope in an upward direction. It does not mean price will continue to move higher. This indicator can also act as a measure of trend strength. A reading of 1.0 indicates that all price movement over the last 200 trading sessions has been contributing to the trend. This indicates an extremely strong trend. A reading of 0.0 indicates none of the price movement has been contributing to the trend and all price movement is random. This indicates a horizontal trading range. A reading of 0.5 indicates 50% of all price movement is contributing to the current trend. It also indicates that 50% of all price movement is random. Therefore, the higher the reading of this indicator the more the movement of price is contributing to the trend and the stronger the trend, and the further this indicator moves downward the more price movement becomes random and the trend becomes weaker. A reading of 50% suggests the strength is neutral. The R-Squared indicator is currently above the critical level indicating a statistical 95% confidence level that the upward trend will continue. Further, the current reading of the R-Squared indicator is 0.53 indicating the strength of the current trend is neutral. |
| The bottom subchart in Figure 1 shows the daily closing price of the DJIA along with its LRTL and the upper and lower 1, 2, and 3 sigma channel lines. What is important to note here is the closing price has moved below the -3 sigma channel line to signal a reversal in trend ahead. In conclusion, statistical analysis of the long term-trend shows the DJIA remains in a statistically significant upward trend. Further, the Linear Regression Slope indicator indicates buyers are becoming less aggressive in their buying. This action normally occurs near a market top when traders are not sure if they should add to their positions or lighten up. To reverse the long-term trend from up to down the Linear Regression Slope indicator needs to move below its zero line and the R-Squared indicator below its critical level and then back above up. Looking at the chart it is obvious that more time is needed before a long-term reversal in the trend of the DJIA can occur. However, it is not obvious that price will continue to make new higher highs. It is also obvious that a reversal in trend most likely lies ahead. "Long term upward trends take a short time to develop, but a long time to dissipate." - Alan Northam |
Alan Northam lives in the Dallas, Texas area and as an electronic engineer gave him an analytical mind from which he has developed a thorough knowledge of stock market technical analysis. His abilities to analyze the future direction of the stock market has allowed him to successfully trade of his own portfolio over the last 30 years. Mr. Northam is now retired and trading the stock market full time. You can reach him at inquiry@tradersclassroom.com or by visiting his website at http://www.tradersclassroom.com. You can also follow him on Twitter @TradersClassrm.
| Garland, Tx | |
| Website: | www.tradersclassroom.com |
| E-mail address: | inquiry@tradersclassroom.com |
Click here for more information about our publications!
Comments

Request Information From Our Sponsors
- StockCharts.com, Inc.
- Candle Patterns
- Candlestick Charting Explained
- Intermarket Technical Analysis
- John Murphy on Chart Analysis
- John Murphy's Chart Pattern Recognition
- John Murphy's Market Message
- MurphyExplainsMarketAnalysis-Intermarket Analysis
- MurphyExplainsMarketAnalysis-Visual Analysis
- StockCharts.com
- Technical Analysis of the Financial Markets
- The Visual Investor
- VectorVest, Inc.
- Executive Premier Workshop
- One-Day Options Course
- OptionsPro
- Retirement Income Workshop
- Sure-Fire Trading Systems (VectorVest, Inc.)
- Trading as a Business Workshop
- VectorVest 7 EOD
- VectorVest 7 RealTime/IntraDay
- VectorVest AutoTester
- VectorVest Educational Services
- VectorVest OnLine
- VectorVest Options Analyzer
- VectorVest ProGraphics v6.0
- VectorVest ProTrader 7
- VectorVest RealTime Derby Tool
- VectorVest Simulator
- VectorVest Variator
- VectorVest Watchdog