

HOT TOPICS LIST
- MACD
- Fibonacci
- RSI
- Gann
- ADXR
- Stochastics
- Volume
- Triangles
- Futures
- Cycles
- Volatility
- ZIGZAG
- MESA
- Retracement
- Aroon
INDICATORS LIST
LIST OF TOPICS
PRINT THIS ARTICLE
by Alan R. Northam
Statistical analysis shows the Dow Jones Industrial Average is nearing the end of its long-term upward trend.
Position: N/A
Alan R. Northam
Alan Northam lives in the Dallas, Texas area and as an electronic engineer gave him an analytical mind from which he has developed a thorough knowledge of stock market technical analysis. His abilities to analyze the future direction of the stock market has allowed him to successfully trade of his own portfolio over the last 30 years. Mr. Northam is now retired and trading the stock market full time. You can reach him at inquiry@tradersclassroom.com or by visiting his website at http://www.tradersclassroom.com. You can also follow him on Twitter @TradersClassrm.
PRINT THIS ARTICLE
STATISTICS
Long Term Trend Of The Dow Nears End
04/29/14 03:50:39 PMby Alan R. Northam
Statistical analysis shows the Dow Jones Industrial Average is nearing the end of its long-term upward trend.
Position: N/A
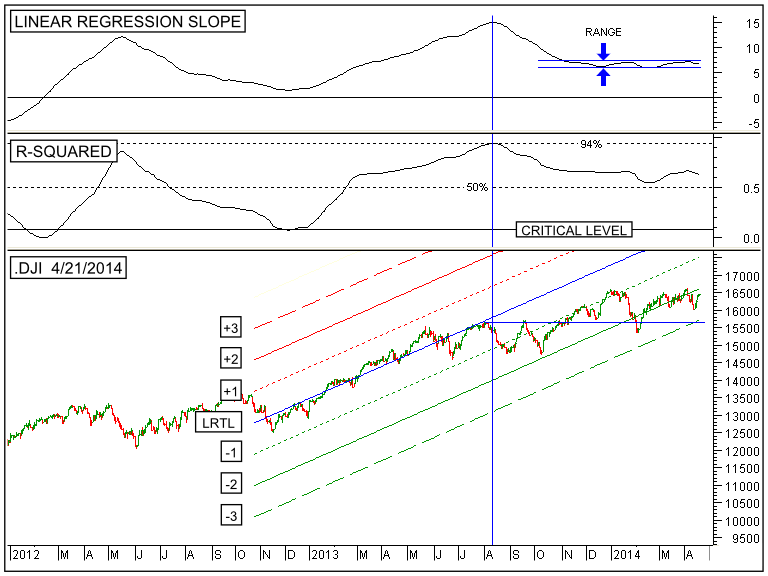
| This article first appeared on November 6, 2013 under the title "Trend Ending For The Dow Jones Industrials"; the following is an update to that article. The bottom panel of Figure 1 shows the daily price bars of the Dow Jones Industrial Average, stock symbol .DJI. This figure also shows the 200-day linear regression trend line (upward sloping blue line) labeled "LRTL". This figure also shows the +1, +2, +3, -1, -2, and -3 sigma channel lines labeled appropriately. The red channel lines represent resistance lines and the green channel lines support. |
|
| FIGURE 1: .DJI, DAILY. This chart shows the daily price chart of the Dow Jones Industrial Average, stock symbol .DJI, in the lower panel along with its 200-day linear regression trend line and channel lines. The top panel shows the Linear Regression Slope indicator followed by the R-Squared indicator in the middle panel. |
| Graphic provided by: MetaStock. |
| |
| A vertical blue line is drawn on the chart at the peak of the Linear Regression Slope indicator (see top panel). The Linear Regression Trend Line (LRTL) in the bottom panel and its associated upper and lower sigma channel lines are drawn on the chart to the left of this vertical blue line from early August 2013 to late October 2012 and cover a period of 200 trading sessions (days). The upward slope of these lines is determined by these 200 trading sessions. To the right of the vertical blue line the LRTL and channel lines extend to show the projected future path of price. The vertical blue line was first placed on the chart in mid-August 2013 when the Linear Regression Slope indicator peaked (see previous article mentioned earlier) and the upward sloping lines to the right of this line represent the price trend (LRTL), resistance lines, and support lines of future price. Since the time the vertical blue line was drawn, and the LRTL and associated channel lines were extended to its right, the chart shows the actual daily price movement versus the projected future price trend. Notice that from August 2013 backwards to late October 2012 the closing price of the Dow Jones Industrial Average traded between the upper and lower one sigma channel lines indicating a strong long-term upward trend (from statistics, the closer the data is to the LRTL the stronger the trend). Further notice that from August 2013 through January 2014 the closing price fell away from the blue upward sloping LRTL trading between the -1 sigma channel line and -2 sigma channel line. This is a sign of increasing volatility which normally occurs near the end of a trend. In late January 2014, price closed below the -2 sigma channel line for the first time to warn of a possible reversal in trend ahead. Then from February 2014 through March 2014 price remained glued to the -2 sigma channel line when in early April 2014 price once again closed below the -2 sigma channel line to send a second warning of a possible reversal in trend ahead. |
| In the top panel of Figure 1 is plotted the Linear Regression Slope indicator. When this indicator is above its zero line and moving upward it indicates an accelerating upward trend. When this indicator is above its zero line and moving in a downward direction, as it did between August 2013 and December 2013, it indicates, while the trend is in an upward direction, price has entered into a period of price deceleration. What is important to know about periods of price deceleration is that they normally occur near the end of a trend. However, there are some exceptions: One exception is that on occasion price can re-accelerate to the point that the Linear Regression Slope Indicator makes a new higher high ending the period of price deceleration. This occurred between May 2012 and December 2012. Another, is that price sometimes makes a final higher high before the trend ends as it has between August 2013 and December 2013. With price having made a higher high the probability increases significantly that the long-term trend of the Dow Jones Industrial Average is nearing its end. From December 2013 through April 2014 notice that the Linear Regression Slope Indicator has been moving sideways in a small range. In itself, this sideways movement doesn't end the period of price deceleration. However, we must now wait and see if the period of price deceleration will continue by a break down below this range or if price will start to re-accelerate a second time by a break out above this range. |
| The next lower panel shows the R-Squared indicator, a measure of confidence in the trend as well as a measure of its strength. When this indicator is above its critical level, as it is now, it indicates a 95% statistical confidence level the trend will continue, as it has done way back since its crossing in February 2012. This indicator also acts as a measure of the trend's strength. The strength of the current trend is determined by measuring what percentage of price movement over the last 200 trading sessions has been considered to be trending, or adding to the upward price movement. In August 2013, this indicator read 0.94 meaning that 94% of the daily price movement was contributing to the trend. The latest reading of 0.63 means 63% of the daily price movement is contributing to the trend. By inference it also means 37% of the price movement has not been contributing to the trend but simply moving in a random fashion. Another way of looking at this information is the more random the daily price movement the weaker the trend (a complete random movement of price, R-Squared below its critical level, manifests itself as a trading range). |
| In conclusion, statistical analysis of the long-term upward trend shows the Dow Jones Industrial Average remains statistically significant. As long as this trend remains statistically significant its trend should be expected to continue. By this it is meant a long-term downward trend will not develop. However, it is also shown that from August onward price has been in a period of deceleration that normally occurs near the end of a trend. Thus while we should continue to expect the long-term upward trend to continue we may or may not see prices make new higher highs. This analysis also shows the long-term upward trend of the Dow Jones Industrial Average has been weakening since August 2012. Thus, while the long-term upward trend of the Dow Jones Industrial Average remains statistically significant, it has been weakening and closing in on its end. |
Alan Northam lives in the Dallas, Texas area and as an electronic engineer gave him an analytical mind from which he has developed a thorough knowledge of stock market technical analysis. His abilities to analyze the future direction of the stock market has allowed him to successfully trade of his own portfolio over the last 30 years. Mr. Northam is now retired and trading the stock market full time. You can reach him at inquiry@tradersclassroom.com or by visiting his website at http://www.tradersclassroom.com. You can also follow him on Twitter @TradersClassrm.
| Garland, Tx | |
| Website: | www.tradersclassroom.com |
| E-mail address: | inquiry@tradersclassroom.com |
Click here for more information about our publications!
Comments
Date:�05/01/14Rank:�1Comment:�Lin Reg (200 days) from August 2013 is still strong going up.How you can find evidence to support weakness is beyond me. What about using Lin Reg 100 or even 60 days?

Request Information From Our Sponsors
- StockCharts.com, Inc.
- Candle Patterns
- Candlestick Charting Explained
- Intermarket Technical Analysis
- John Murphy on Chart Analysis
- John Murphy's Chart Pattern Recognition
- John Murphy's Market Message
- MurphyExplainsMarketAnalysis-Intermarket Analysis
- MurphyExplainsMarketAnalysis-Visual Analysis
- StockCharts.com
- Technical Analysis of the Financial Markets
- The Visual Investor
- VectorVest, Inc.
- Executive Premier Workshop
- One-Day Options Course
- OptionsPro
- Retirement Income Workshop
- Sure-Fire Trading Systems (VectorVest, Inc.)
- Trading as a Business Workshop
- VectorVest 7 EOD
- VectorVest 7 RealTime/IntraDay
- VectorVest AutoTester
- VectorVest Educational Services
- VectorVest OnLine
- VectorVest Options Analyzer
- VectorVest ProGraphics v6.0
- VectorVest ProTrader 7
- VectorVest RealTime Derby Tool
- VectorVest Simulator
- VectorVest Variator
- VectorVest Watchdog